
James Wong
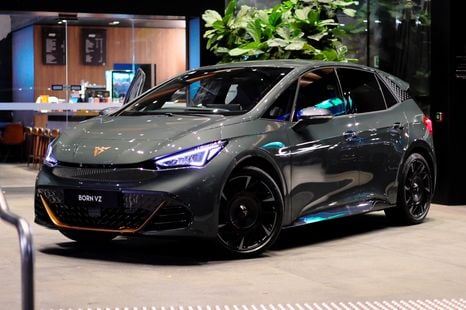
Cupra Born VZ arrives in Australia – with a catch
The 245kW Cupra Born VZ electric hot hatch has finally arrived in Australia, but only as a one-off unit that has already been sold to a keen customer.
3 Hours Ago
A decade ago the Holden Commodore was king and no SUV was a top 15-seller. Let's take a quick look at some major areas of change.

Senior Contributor
Senior Contributor
The pace of change is always rising, and new technologies come thick and fast.
But if we step back a bit and look at the Australian new vehicle sales figures from a decade ago and compare them to today, just how different do the two periods look?
What sort of vehicles have Australians fallen for, and abandoned? What are the defining cars, brands and segments of each year? All up, what’s changed?
The VFACTS market sales database distributed by the Federal Chamber of Automotive Industries lets us look at some numbers from then and now. Such as:
To the end of September 2021, Australian new vehicle sales sit at 816,140. By contrast, sales over the same January to September period in 2011 were 752,128 sales – 8.5 per cent lower.
But this figure is the result of many variables and doesn’t mean much. What’s more interesting is how the market make-up has changed at the next level down.
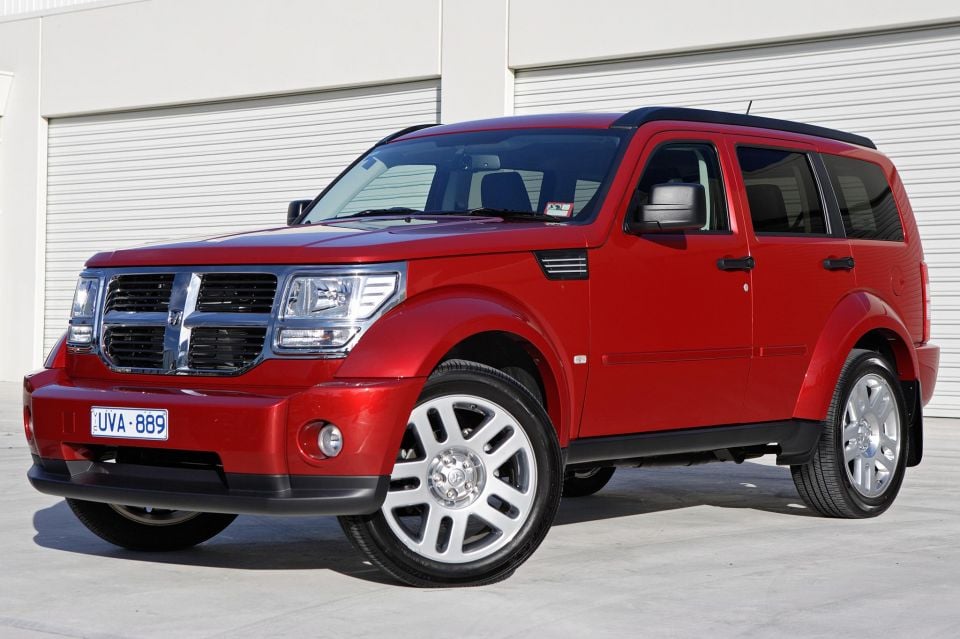
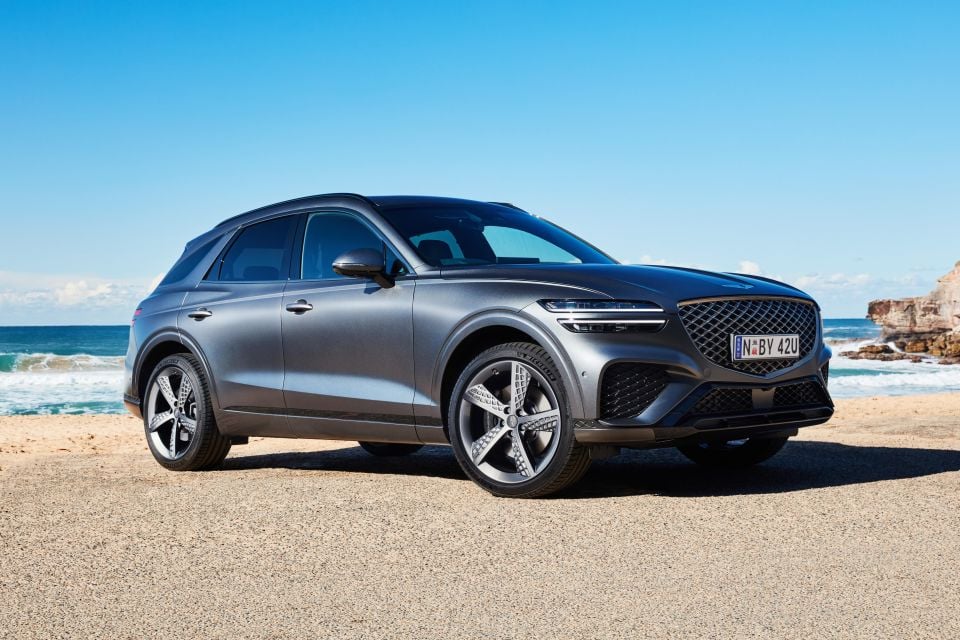
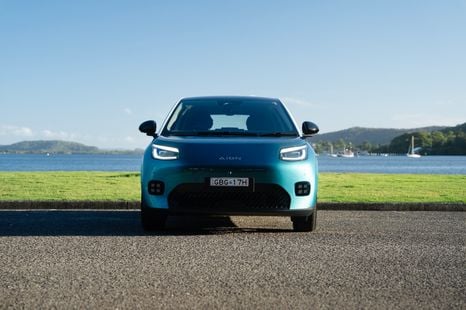
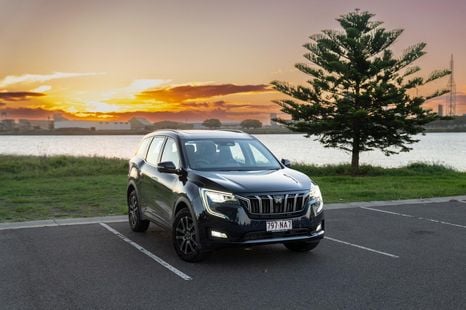
Brands that were on sale then and aren’t now include Chery, Dodge, Holden, Hummer, Proton, Saab, and Smart. New entrants are Chevrolet, Genesis, Haval, LDV, MG, Ram Trucks, and Tesla.
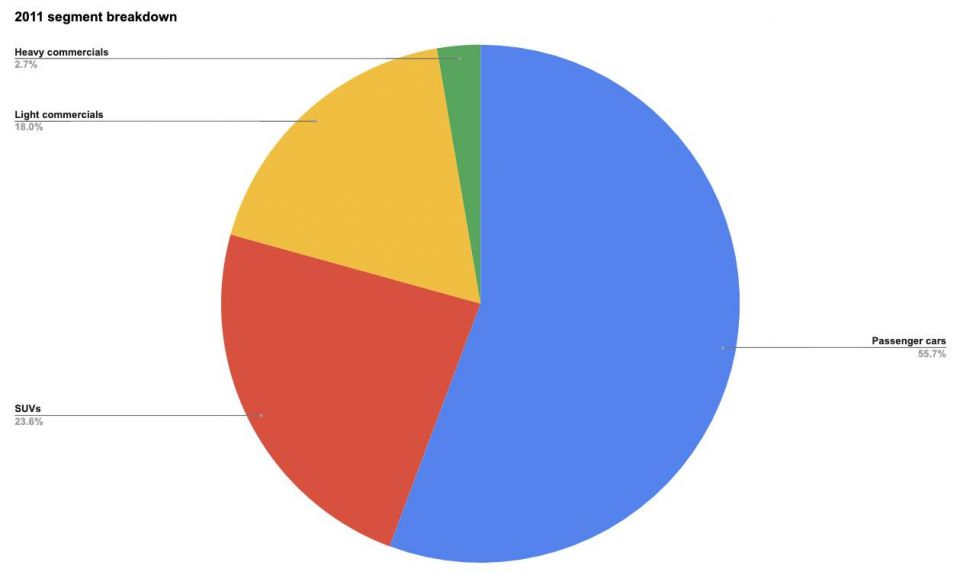
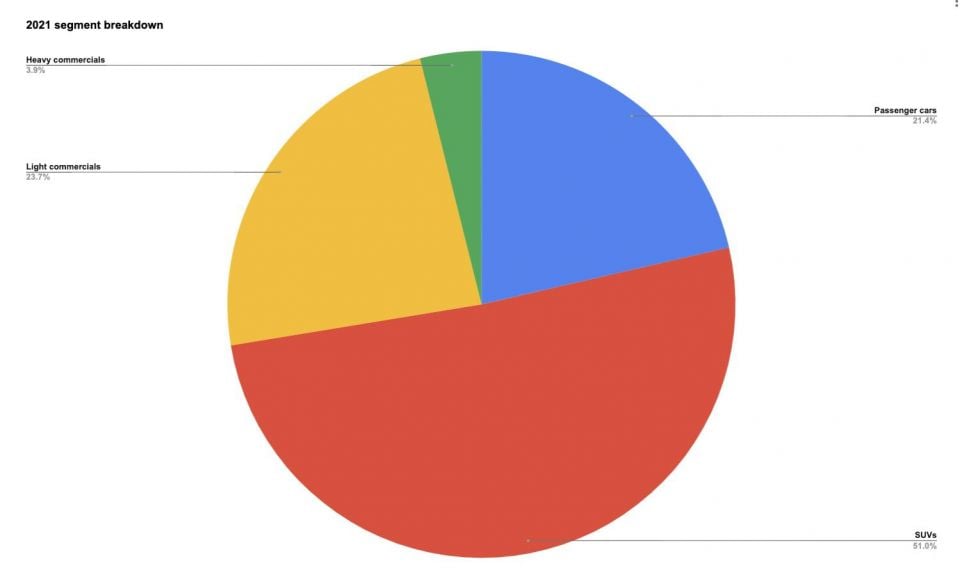
Then, 55.7 per cent of sales were classified Passenger Cars (hatchbacks, sedans, wagons, coupes, convertibles, and people-movers). In 2021 their share has plummeted to 21.4 per cent.
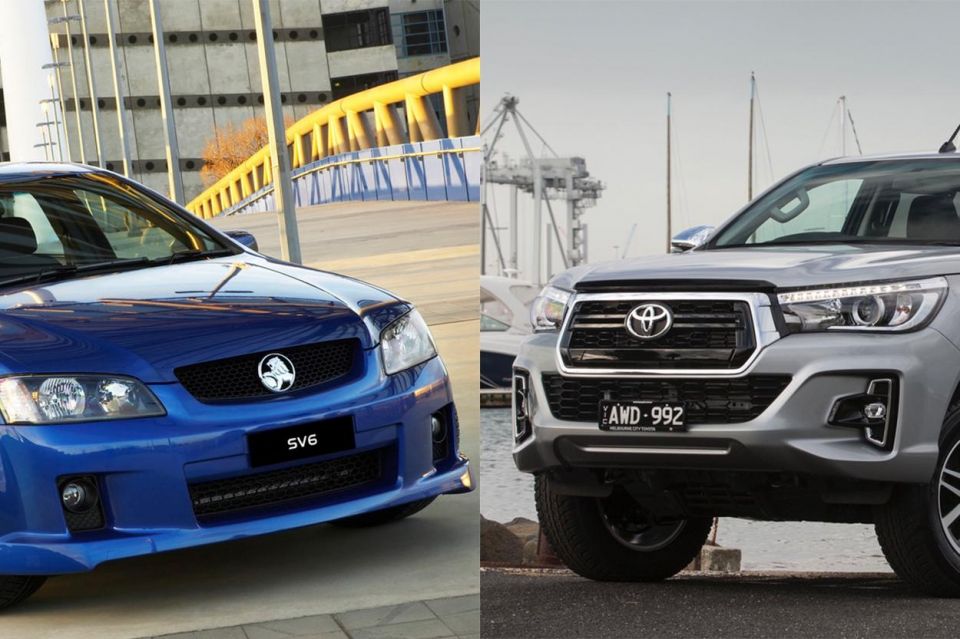
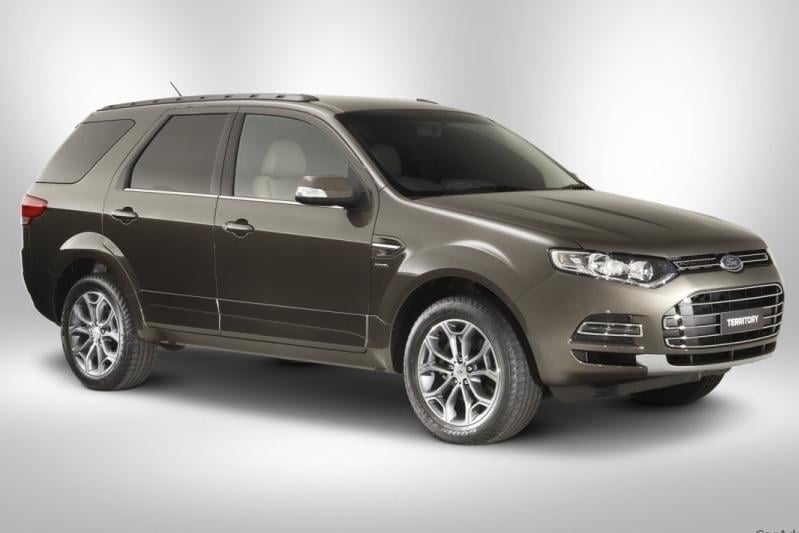
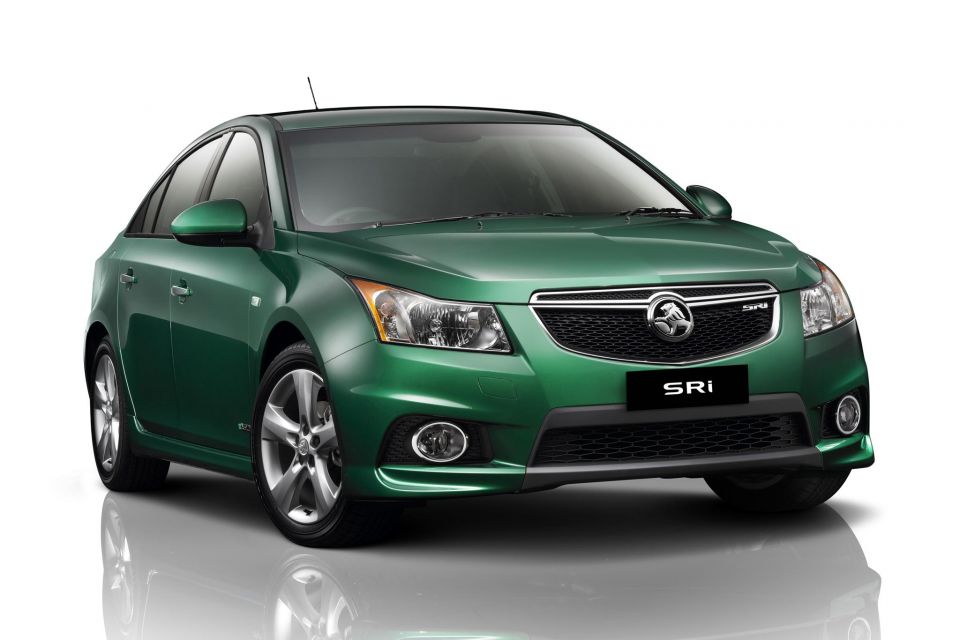
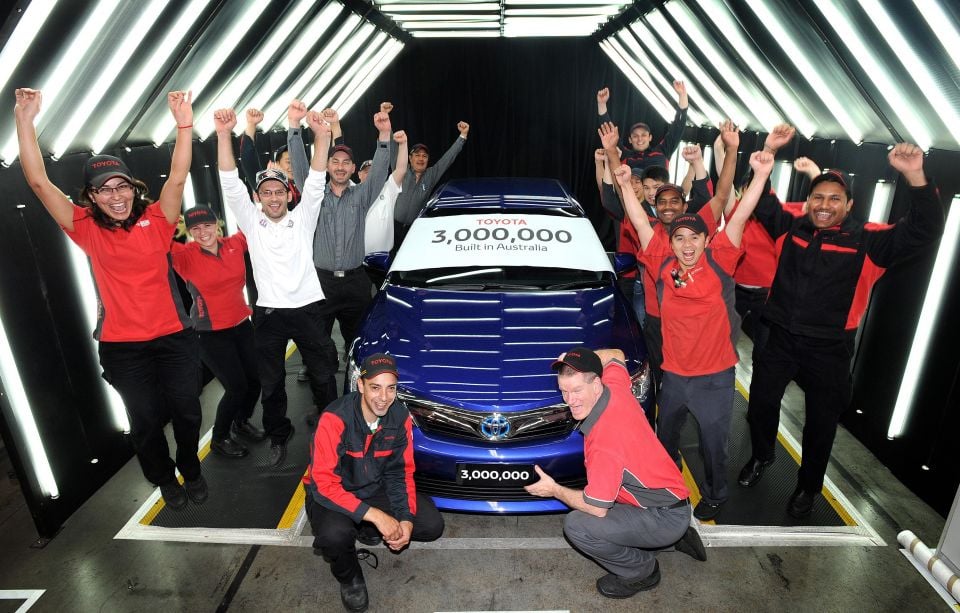
The biggest loser was, of course, the Large Car segment occupied by the defunct Holden Commodore and Ford Falcon.
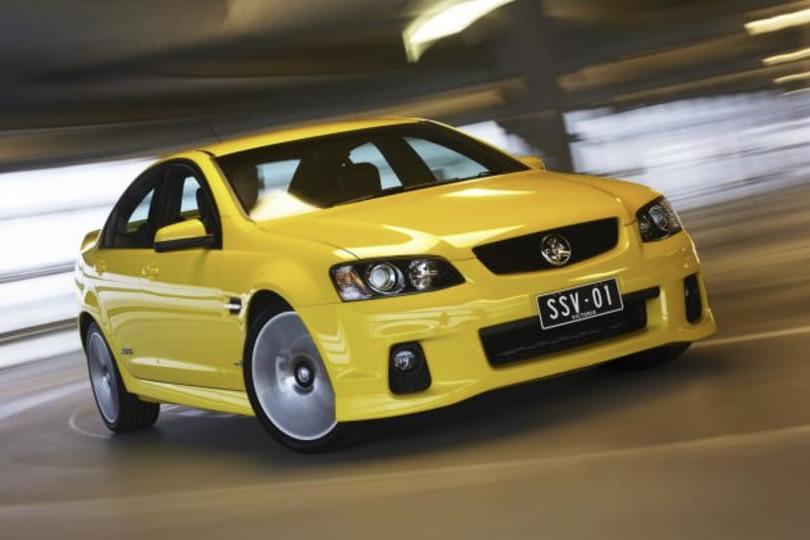
In 2011 Large Cars owned 8.1 per cent share (and falling), whereas today the segment sits at a paltry 0.5 per cent.
The other major change is at the cheaper end, which is being eroded by SUVs and used car sales (prices of which are at all-time highs).
In 2011 Light Cars such as the Mazda 2 and Toyota Yaris had 13.3 per cent market share while today that figure including the Micro Car segment sits at 5.2 per cent.
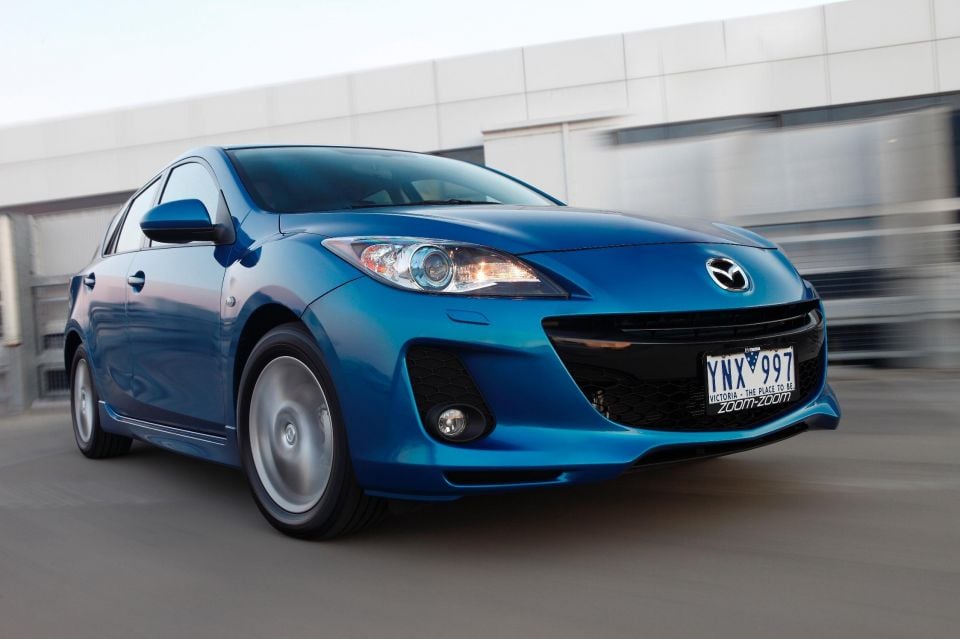
Small Cars such as the Mazda 3 and Toyota Corolla were dominant in 2011 with 24.1 per cent overall market share, whereas today this figure is just 10.7 per cent.
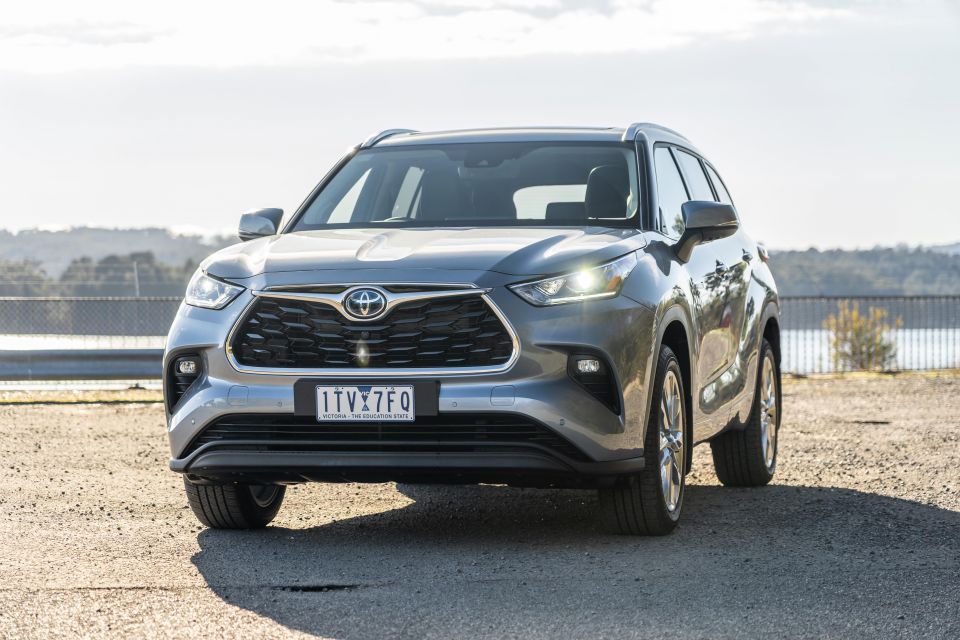
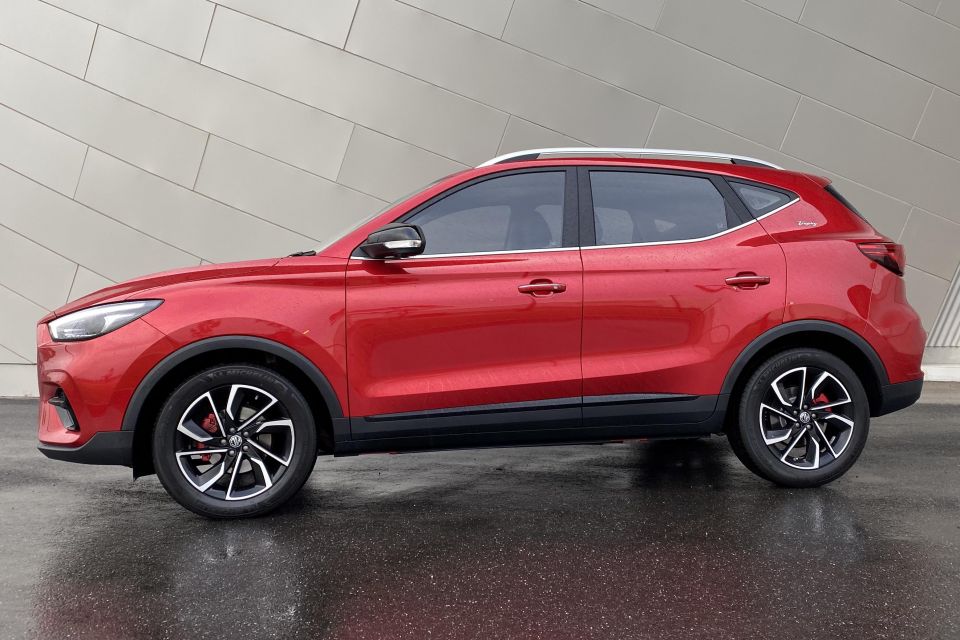
In 2011 the market share of SUVs was 23.6 per cent and growing, whereas in 2021 this figure has rocketed to 51.0 per cent.
Australians sure have fallen head over heels for SUVs in the interim, with more options falling under this classification and manufacturers all too eager to cash in.
In 2011 there were 70 different SUV models produced by 28 brands. In 2021 there are 127 SUV models to choose from made by 38 brands.
The single Compact SUV segment in 2011 had 11.8 per cent share of the market.
Today this one segment has branched into sub-classifications called Light SUV, Small SUV and Medium SUV, which combined have 35.9 per cent share.
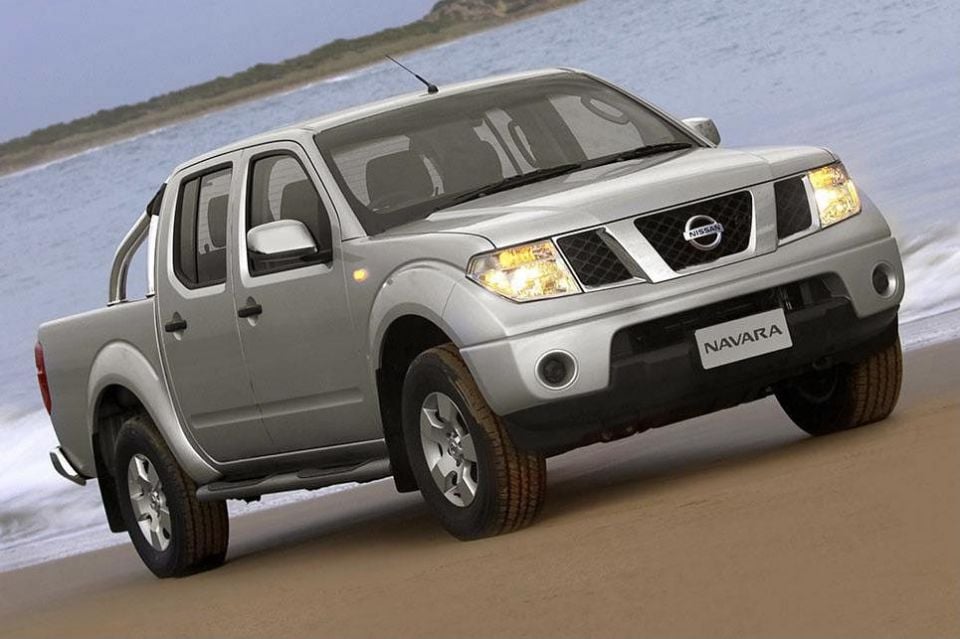
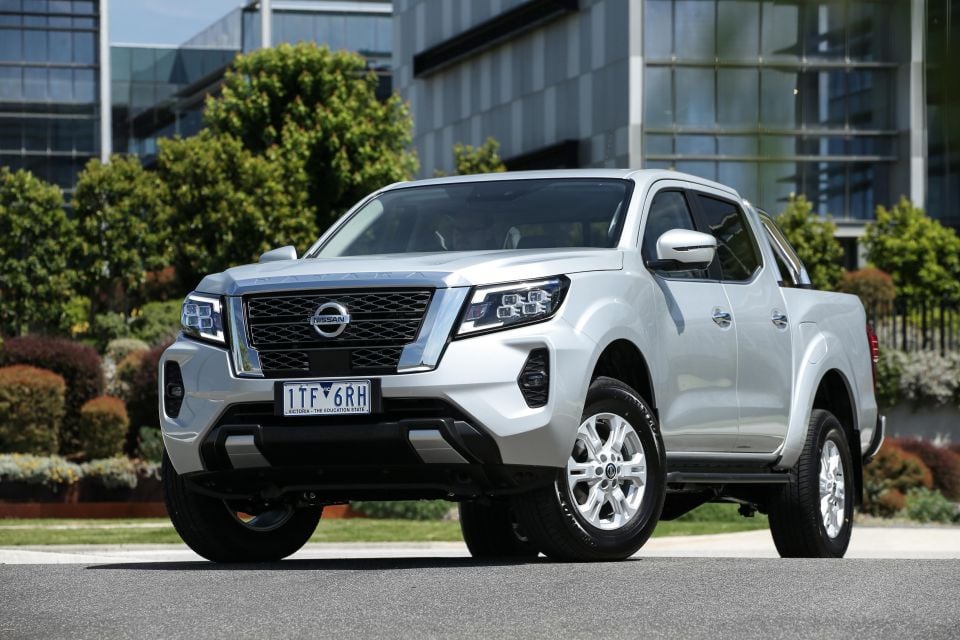
Light commercial utes and vans have gone from 18.0 per cent in 2011 to 23.7 per cent in 2021.
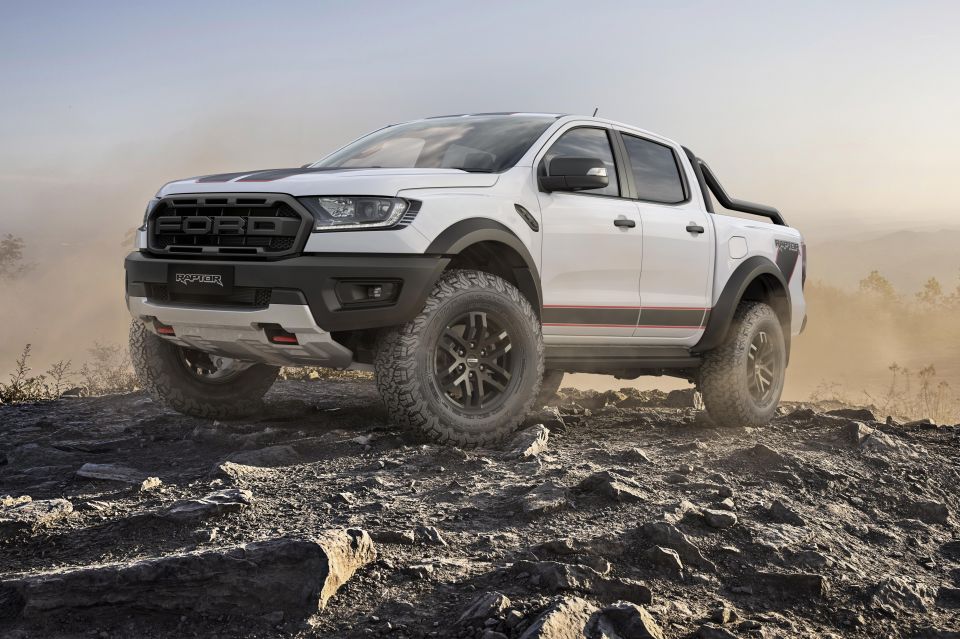
Particularly successful today are dual-cab 4×4 utes, which have become the two top-selling vehicles overall (Ford Ranger and Toyota HiLux), and which are now genuinely enthusiast-focused at the top end.
Overall market share of 4×4 utes has grown from 10 per cent to 18 per cent over the decade.
In 2011, the top 10 brands and their respective sales were:
In 2021, the top 10 brands and their respective sales are:
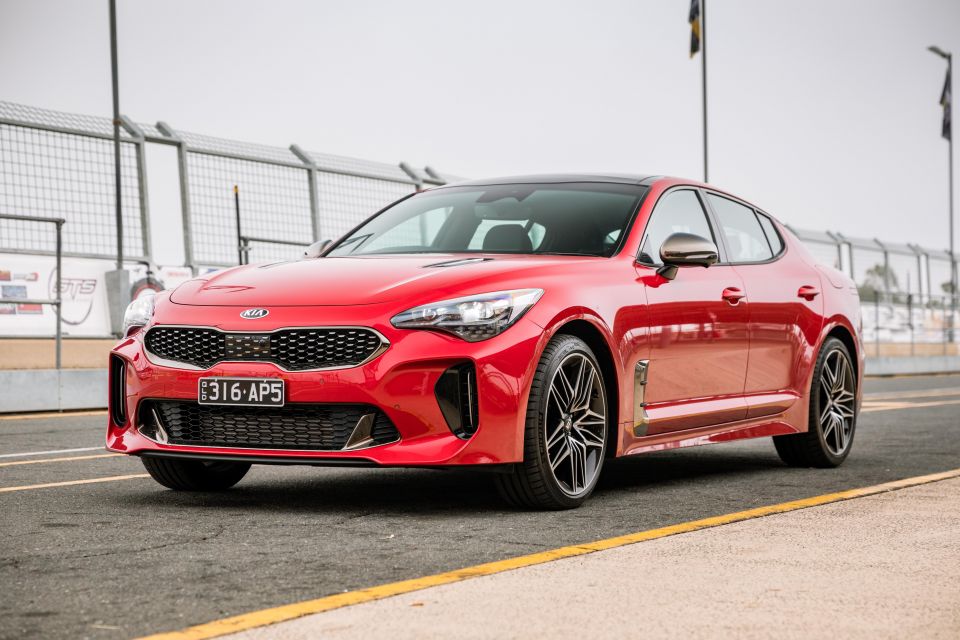
Which means over the period we’ve seen Holden and Honda out of the top 10, and Kia and MG power in. If we track the movement of some major brands over the period from 2011 to 2021 it looks like this:
| 2011 | 2021 | Change % | |
|---|---|---|---|
| Audi | 11,304 | 12,651 | Up 11.9% |
| BMW | 12,809 | 18,965 | Up 48.1% |
| Ford | 69,495 | 54,269 | Down 21.9% |
| Great Wall | 6136 | 13,200 | Up 115.1% |
| Honda | 23,490 | 13,460 | Down 42.7% |
| Hyundai | 65,129 | 54,169 | Down 16.8% |
| Isuzu Ute | 4672 | 28,437 | Up 508.7% |
| Jeep | 5990 | 5976 | Down 0.2% |
| Kia | 19,025 | 53,316 | Up 180.2% |
| Land Rover | 4403 | 5,693 | Up 29.3% |
| Lexus | 4498 | 7455 | Up 65.7% |
| Mazda | 65,955 | 83,565 | Up 26.7% |
| Merc-Benz | 15,614 | 26,182 | Up 67.7% |
| Mitsubishi | 46,107 | 52,152 | Up 13.1% |
| Nissan | 50,659 | 31,652 | Down 37.5% |
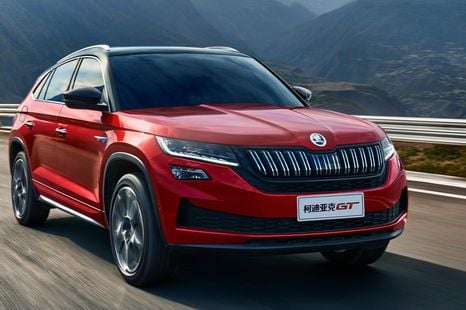
| Skoda | 1839 | 7745 | Up 321.2% |
| Subaru | 26,874 | 28,763 | Up 7.0% |
| Suzuki | 18,188 | 13,314 | Down 27.0% |
| Toyota | 131,371 | 176,771 | Up 34.5% |
| Volkswagen | 32,153 | 32,315 | Up 0.5% |
| Volvo | 3969 | 7339 | Up 84.9% |
There has been enormous change when we sift through the top 15 cars then versus now.
In 2011, the top 15 models and their respective sales were:
That list comprises 11 passenger vehicles, four light commercials, and zero SUVs.
In 2021, the top 15 models and their respective sales are:
That list by contrast comprises four passenger vehicles, five light commercials, and six SUVs.
In 2011, the top sources of vehicles were:
In 2021, the top sources of vehicles are:
Out, Australia. In, China.
Got any questions about car sales? Ask away in the comments and I’ll jump in!
James Wong
3 Hours Ago

Josh Nevett
3 Hours Ago

CarExpert
4 Hours Ago

Derek Fung
4 Hours Ago

Andrew Maclean
11 Hours Ago

William Stopford
1 Day Ago
Add CarExpert as a Preferred Source on Google so your search results prioritise writing by actual experts, not AI.