
William Stopford
Mazda extends service intervals for its newest diesel SUVs
You can now drive your six-cylinder diesel Mazda SUV for longer between workshop visits, following a servicing schedule change.
29 Minutes Ago
Australia is having its best new vehicle sales year since 2018, with backorders finally being cleared. But economic challenges lay ahead.

Senior Contributor
Senior Contributor
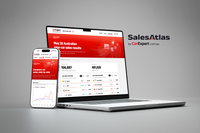
The Australian new vehicle market broke the all-time July sales record last month, with 96,589 sales to be up 14.7 per cent year-over-year with the same number of selling days.
The previous July record was 92,754 units back in 2017.
The strong performance – mirrored across all states and territories – is indicative of improved supply and the subsequent clearing of order backlogs that have frustrated customers and dealers alike.
The July result builds on the 2023 market yielding the best June result in five years, an all-time record for May. Year-to-date the new vehicle market sits at 9.0 per cent up over 2022, making it the best result since 2018.
Sales results to the end of July:
| Year (Jan-July) | Sales in units |
|---|---|
| 2023 | 678,618 |
| 2022 | 622,319 |
| 2021 | 651,629 |
| 2020 | 514,920 |
| 2019 | 637,650 |
| 2018 | 691,073 |
| 2017 | 692,306 |
| 2016 | 689,471 |
| 2015 | 670,735 |
| 2014 | 649,815 |
“During the past twelve months the issue has been one of securing supply for consumers, however as these pressures ease, we are starting to see a return to more stable market conditions,” said Federal Chamber of Automotive Industries chief Tony Weber.
“[However] many of these vehicles were ordered several months ago, so it is important to monitor the broader economic conditions through 2023 and their impact on private and business demand.”
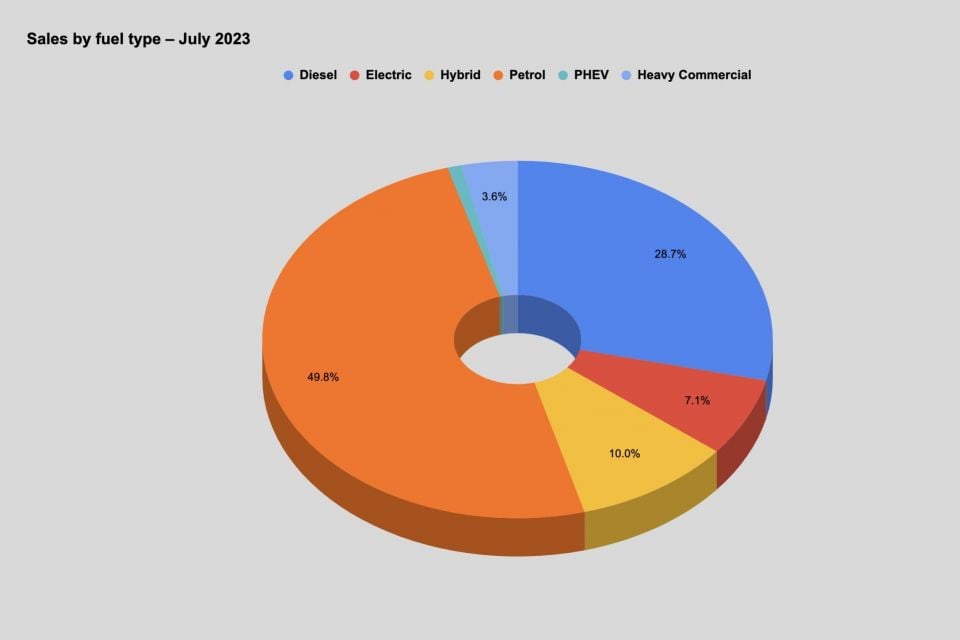
Sales of zero and low emission (tailpipe) vehicles continued to grow with 17.9 per cent being battery electric, hybrid or plug-in hybrid models. BEVs accounted for 7.0 per cent of July sales.
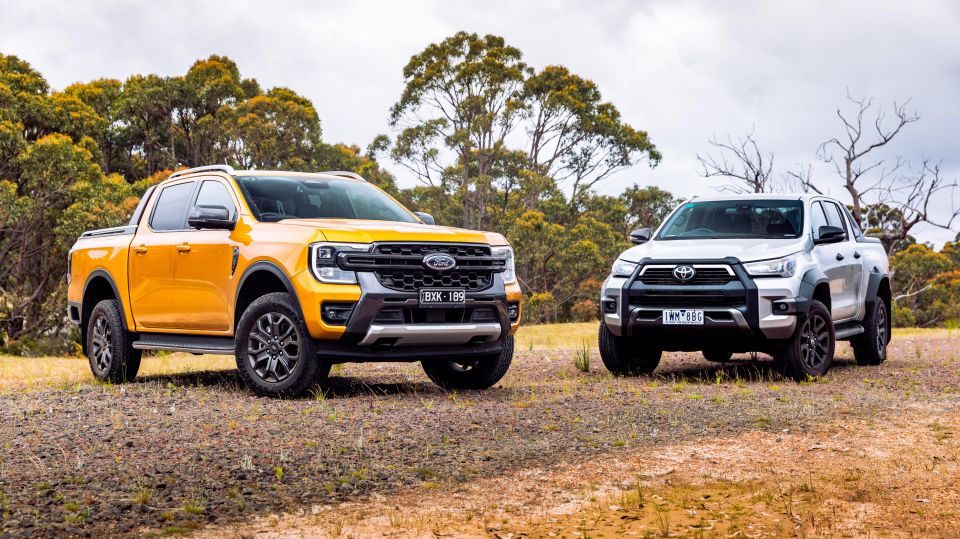
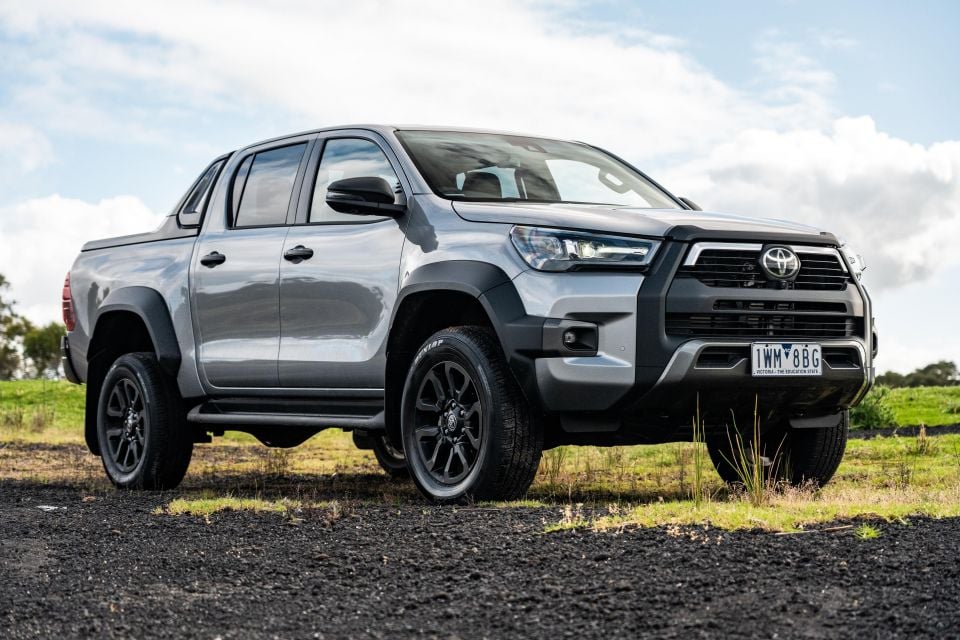
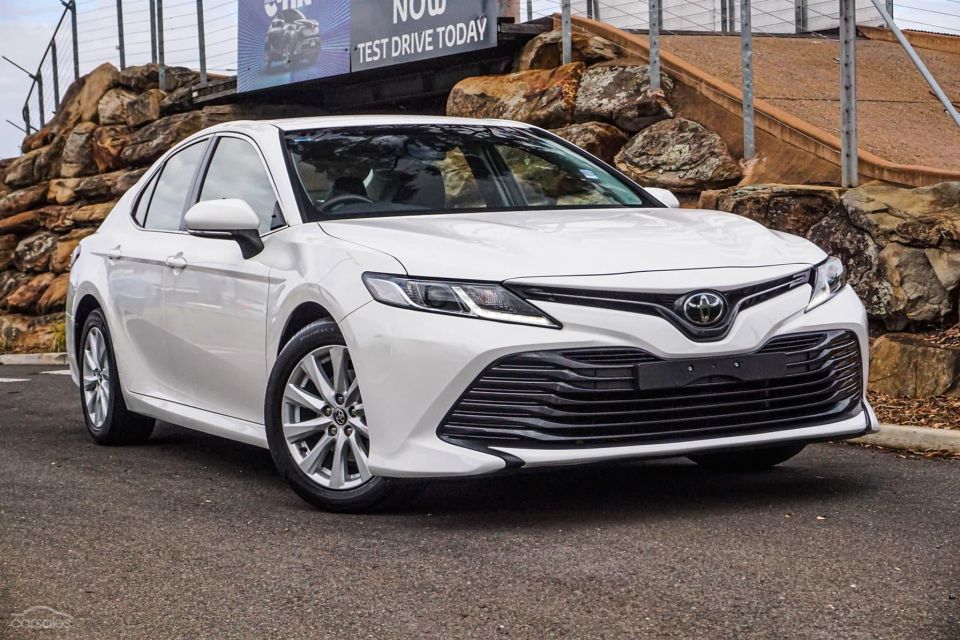
Toyota had a better month relatively speaking than it did June, with its market share subsequently recovering to 19.8 per cent – something closer to the norm. Staples such as the Corolla (up 8.2 per cent), RAV4 (up 12.8 per cent), and Prado (up 75.4 per cent) benefitted from better supply.
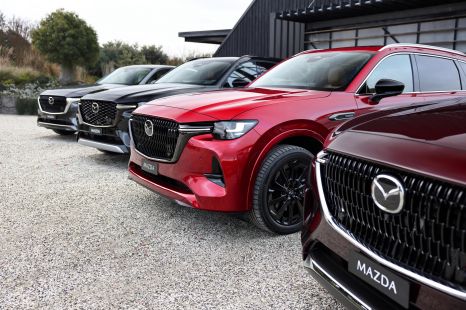
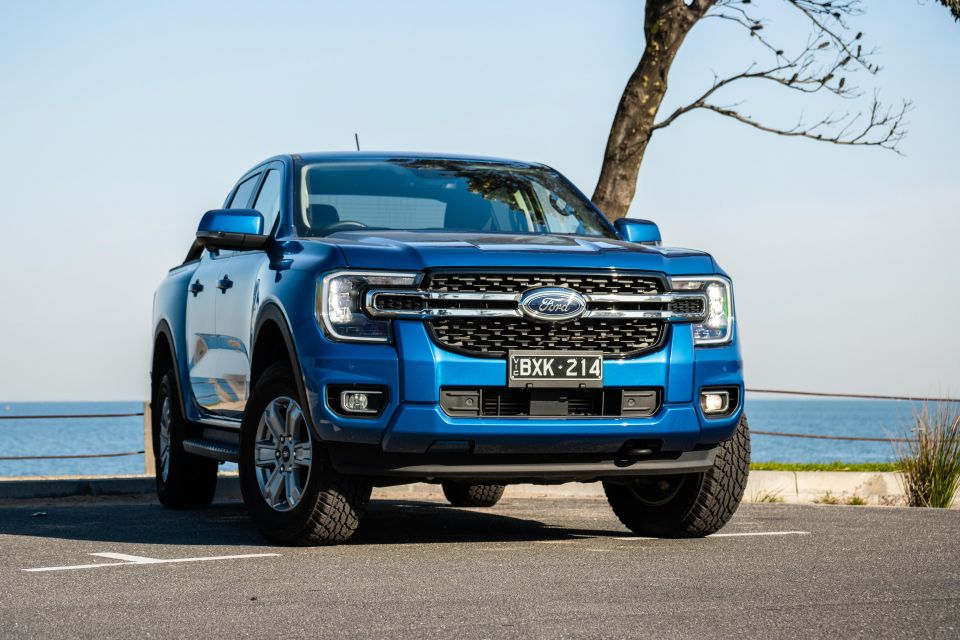
Next in the running order were Mazda (up 5.4 per cent), Ford (up 60.4 per cent with both Ranger 4×4 and Everest nearly doubling their July 2022 tallies), Hyundai (down 4.0 per cent) and Kia (down 8.4 per cent). Kia (45,310 YTD) still leads its big brother Hyundai (44,228) YTD.
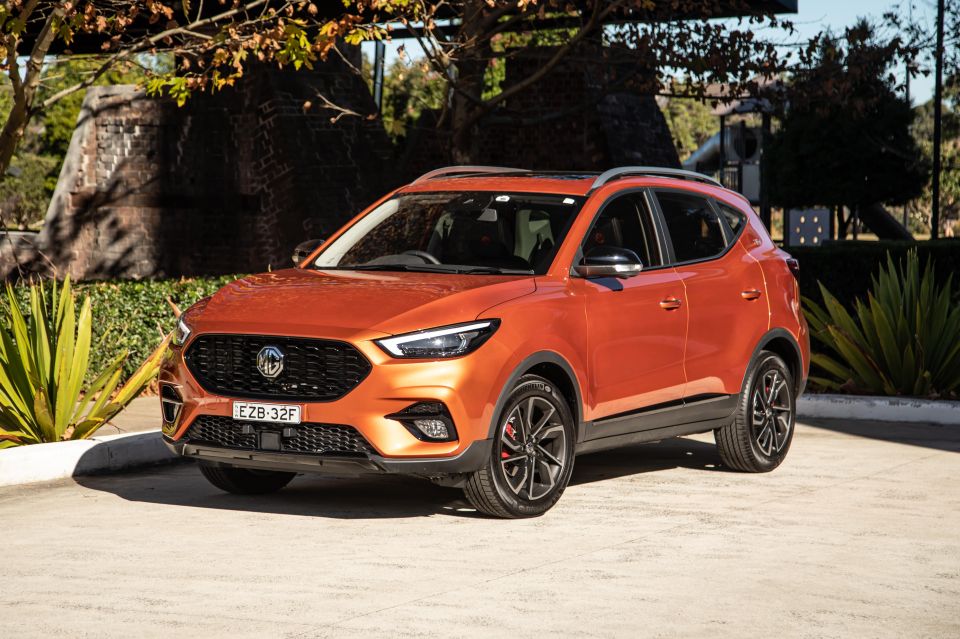
Next were MG (up 77.2 per cent), Mitsubishi (down 26.2 per cent with supply constraints a factor there), Tesla, Subaru (up 25.9 per cent thanks to the new Crosstrek) and Isuzu Ute (up 21.5 per cent).
Other brands that recorded strong results for the month on the back of improved supply included Volkswagen (up 46.8 per cent), Lexus (up 159.3 per cent and on record pace), Skoda (up 26.3 per cent), Land Rover (up 94.5 per cent), and Porsche (up 80.4 per cent).
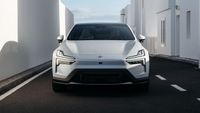
There are a few less-familiar nameplates making inroads such as BYD (1005 sales), Chery (651), Polestar (306), and Cupra (221).
For the full brand sales list for July 2023 see below:
| Brand | Sales | % Change YoY |
|---|---|---|
| Toyota | 19,191 | Down 1.9% |
| Mazda | 8307 | Up 5.4% |
| Ford | 7109 | Up 60.1% |
| Hyundai | 6521 | Down 4.0% |
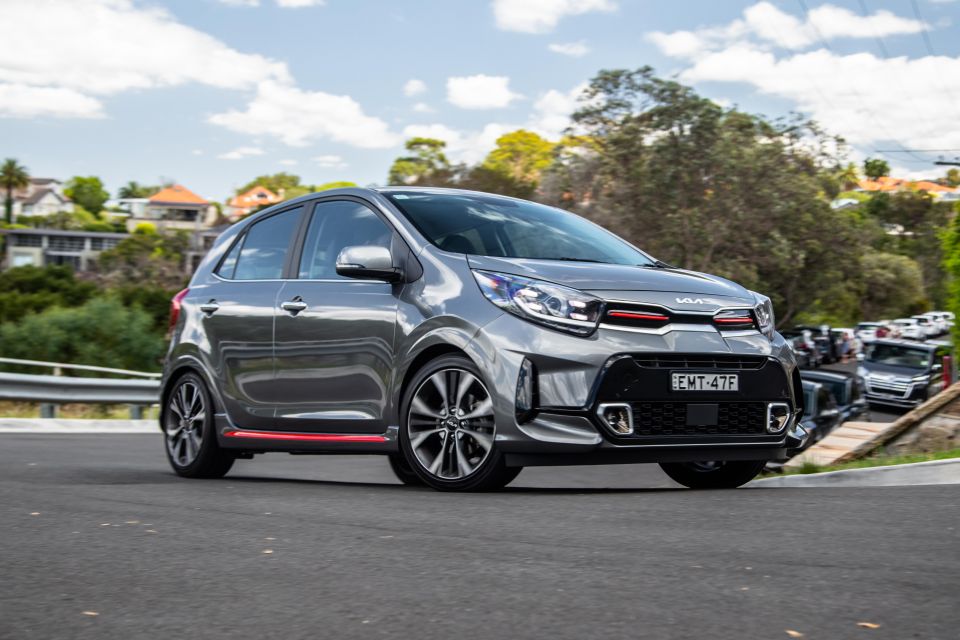
| Kia | 6150 | Down 8.4% |
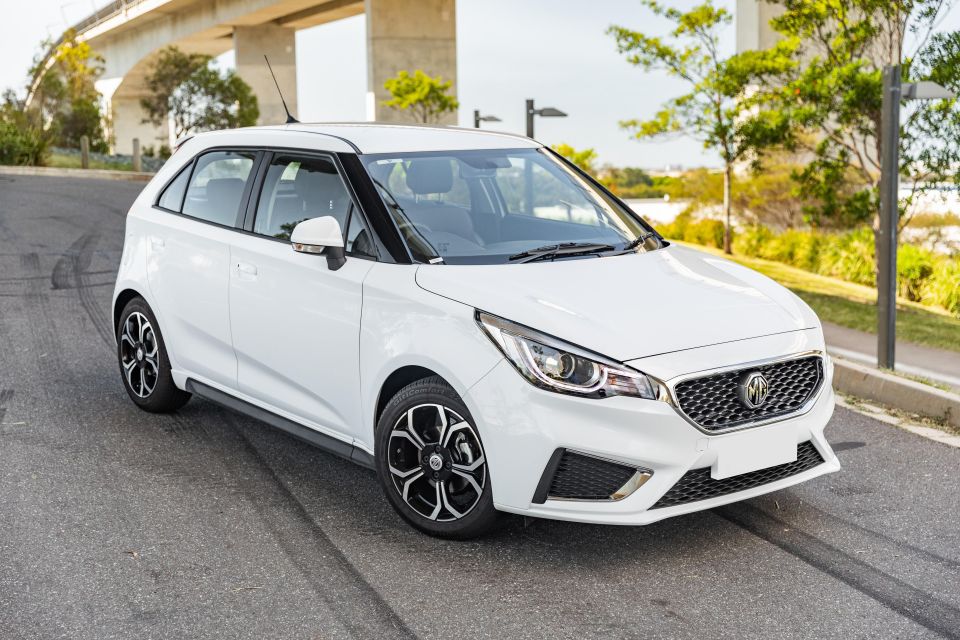
| MG | 5347 | Up 77.2% |
| Mitsubishi | 4143 | Down 26.2% |
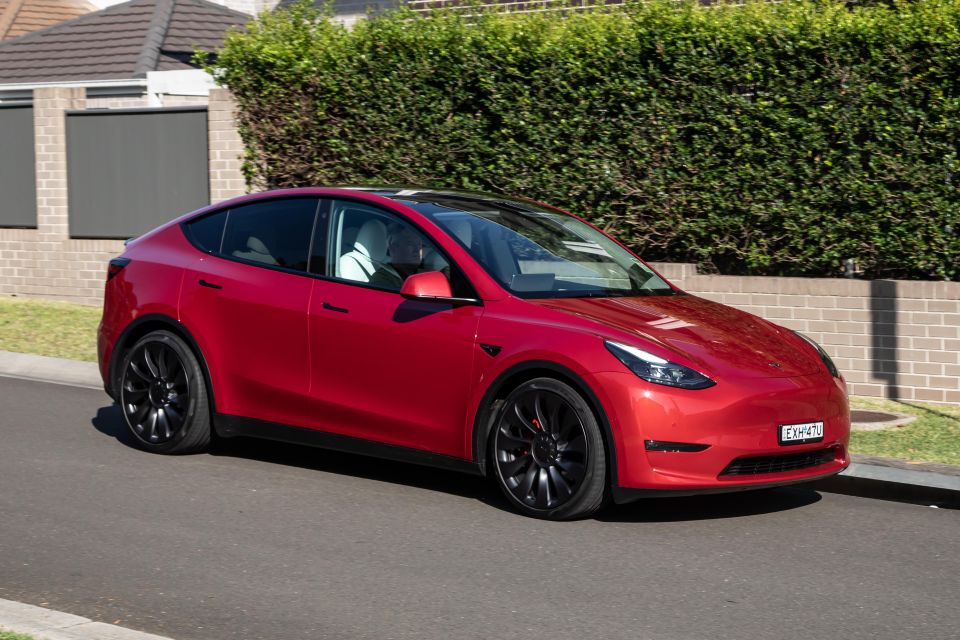
| Tesla | 3934 | Up >999% |
| Subaru | 3553 | Up 25.9% |
| Isuzu Ute | 3340 | Up 21.5% |
| Volkswagen | 2968 | Up 46.8% |
| GWM/Haval | 2564 | Up 20.5% |
| Nissan | 2399 | Up 9.6% |
| Mercedes-Benz | 2317 | Down 18.6% |
| BMW | 1912 | Up 2.5% |
| Suzuki | 1517 | Down 15.3% |
| Lexus | 1390 | Up 159.3% |
| LDV | 1374 | Up 12.8% |
| Audi | 1308 | Down 9.2% |
| BYD | 1005 | NA |
| Honda | 930 | Up 0.2% |
| Volvo | 678 | Up 4.8% |
| Renault | 673 | Up 8.4% |
| Chery | 651 | NA |
| Skoda | 596 | Up 26.3% |
| Land Rover | 562 | Up 94.5% |
| Porsche | 552 | Up 80.4% |
| SsangYong | 476 | Up 30.8% |
| Mini | 439 | Up 37.2% |
| Ram | 378 | Down 11.3% |
| Polestar | 306 | Up 225.5% |
| Jeep | 268 | Down 57.5% |
| Chevrolet | 240 | Up 43.7% |
| Cupra | 221 | Up 351.0% |
| Genesis | 190 | Up 113.5% |
| Peugeot | 188 | Down 15.7% |
| Fiat | 188 | Up 126.5% |
| Alfa Romeo | 76 | Up 145.2% |
| Maserati | 57 | Up 50.0% |
| Jaguar | 41 | Down 29.3% |
| Lamborghini | 37 | Up 37.0% |
| Ferrari | 24 | Up 60.0% |
| Lotus | 24 | NA |
| Bentley | 20 | Up 122.2% |
| Citroen | 19 | Up 18.8% |
| McLaren | 11 | NA |
| Aston Martin | 5 | Down 37.5% |
| Rolls-Royce | 5 | Up 66.7% |
The top 20 nameplates for July 2023 are as follows. The list comprises six mid-sized SUVs, five large SUVs, four pickups, three small SUVs, and two small passenger cars.
Six of the top 20 nameplates were made by Toyota.
Sales by region
Category breakdown
Top segments by market share
Sales by buyer type
Sales by propulsion or fuel type
Sales by country of origin
Got any questions about car sales? Ask away in the comments and we’ll jump in!
William Stopford
29 Minutes Ago

Ben Zachariah
6 Hours Ago

Damion Smy
13 Hours Ago


Josh Nevett
15 Hours Ago


Marton Pettendy
18 Hours Ago
Damion Smy
18 Hours Ago
Add CarExpert as a Preferred Source on Google so your search results prioritise writing by actual experts, not AI.