New vehicle deliveries in Australia climbed a modest 1.3 per cent in April over the same month last year, finishing at 82,137 units.
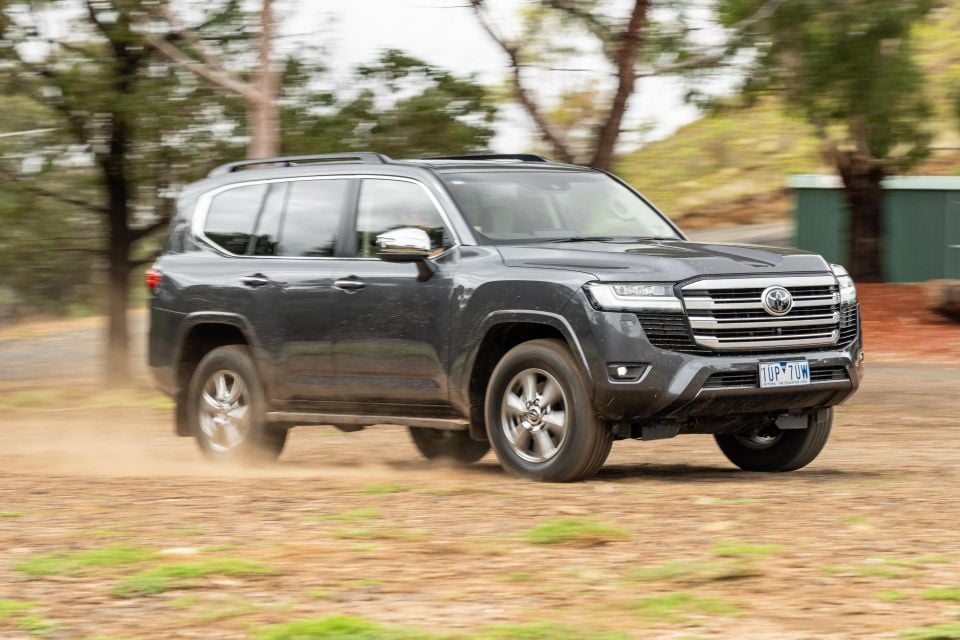
This was driven entirely by growth in SUV sales (up 8.6 per cent), with both light commercials (down 13.1 per cent) and passenger cars (down 1.6 per cent) going in the other direction.
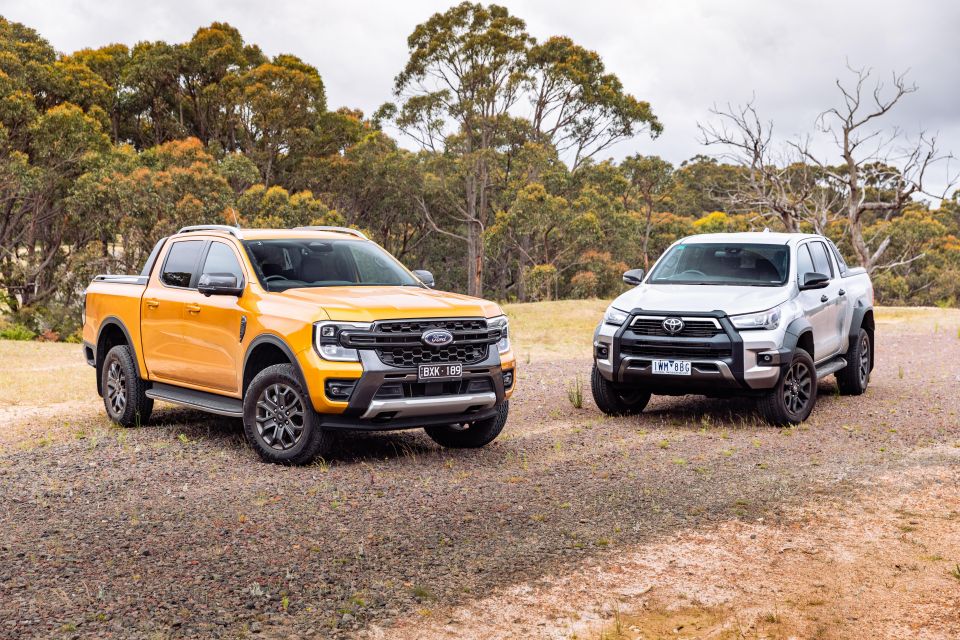
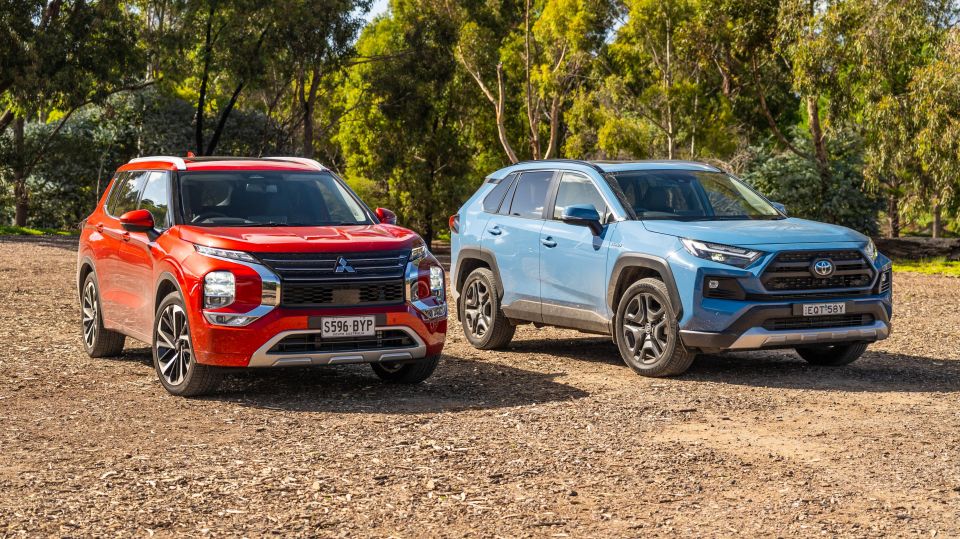
The Ford Ranger topped the charts, narrowly ahead of its Toyota HiLux nemesis, with Toyota’s RAV4 rounding out the podium.
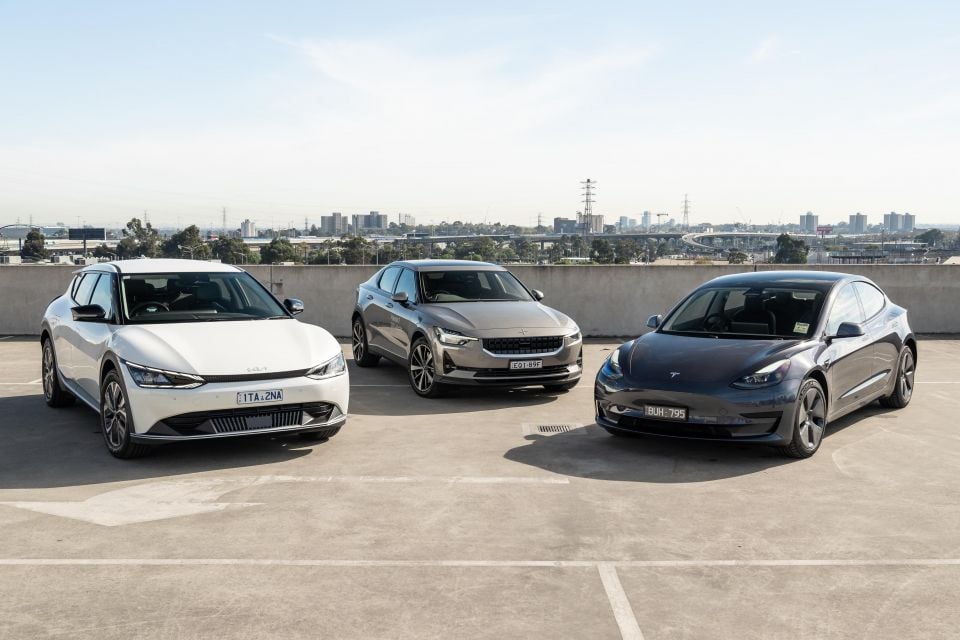
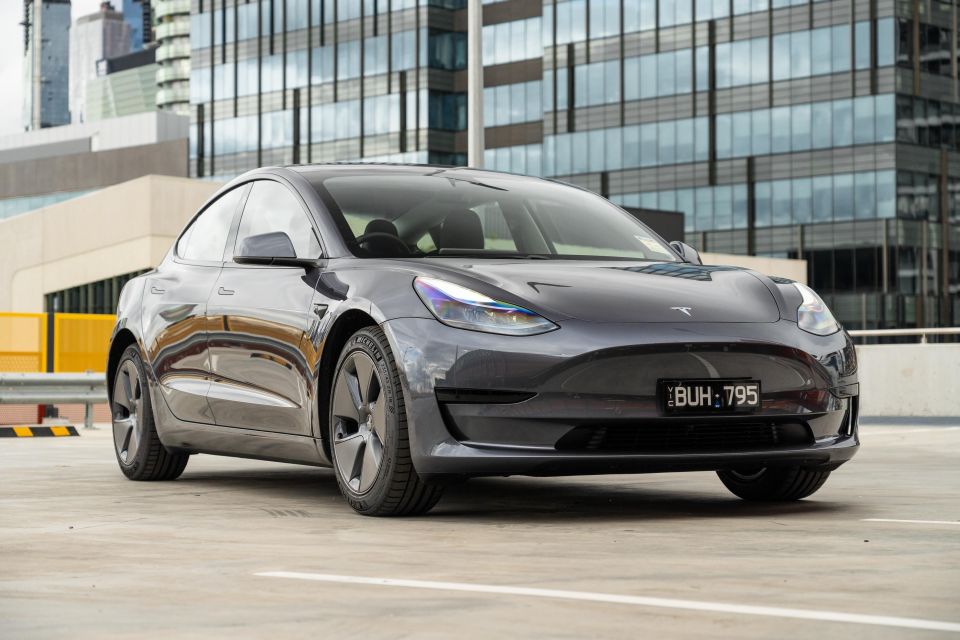
More notable perhaps is the presence of both Tesla models – Model 3 and Model Y – in the overall top 10, helping push EV market share to an increasingly significant 8.0 per cent.
“This is well up from 1.1 per cent compared with April 2022,” said Tony Weber, chief executive of the Federal Chamber of Automotive Industries (FCAI) – the peak lobby group for car brands.
“If you take all forms of electrification, that number has increased from 9.5 per cent to 15.4 per cent, and we know that this number would have been larger had the industry not faced global supply challenges.”
There were 22 selling days in April 2023 compared to 23 in April 2022, so this resulted in an increase of 208.9 vehicle sales per day.
The mild sales growth in April took the market to 351,139 sales after four months, up 2.2 per cent YTD. This is slightly higher than the rolling 10-year average, as the table below shows.
Year
April only
Jan-April
2023
82,137
351,139
2022
81,065
343,501
2021
92,347
355,995
2020
38,926
272,287
2019
75,550
344,088
2018
82,930
374,468
2017
83,135
362,480
2016
87,571
372,899
2015
81,656
359,250
2014
80,710
347,080
Brands
Long-time market leader Toyota continues to be held back by lack of stock, with its sales tumbling 33 per cent year-on-year (YoY) and its market share down at 14.6 per cent, compared to its regular share north of 20 per cent.
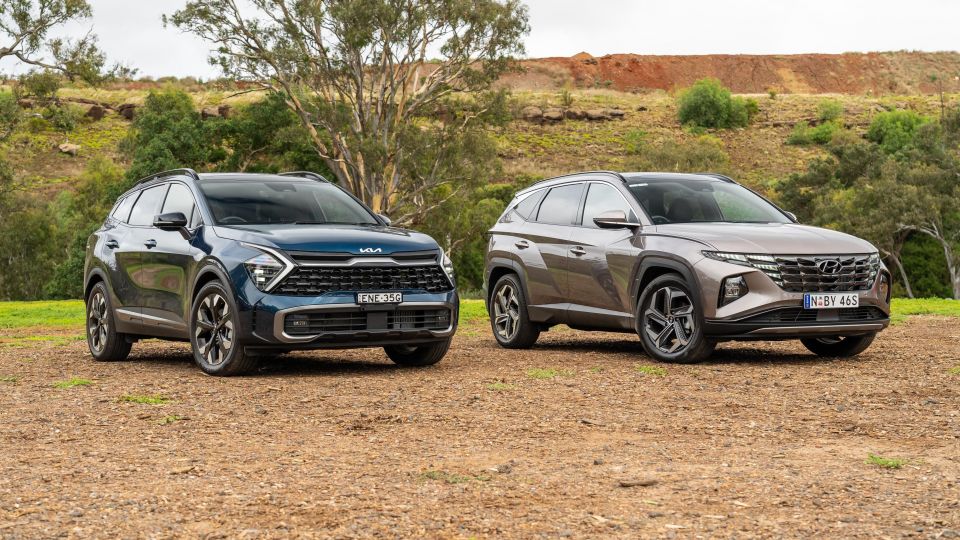
But it was still well ahead of Mazda in second on 6926 (down 6.1 per cent). Kia and Hyundai finished third and fourth respectively, with the former continuing to turn the tables on the latter as Australia’s new favourite Korean brand.
Ford (up 1.5 per cent) rounded out the top five, ahead of Mitsubishi in sixth despite a 31.3 per cent decline. Seventh was Tesla with off-the-charts growth and 3676 sales, ahead of MG (sales declined 27.4 per cent), Nissan (up 46.8 per cent thanks to a brand new SUV range), and Volkswagen (up 71.8 per cent as supply out of Europe improves).
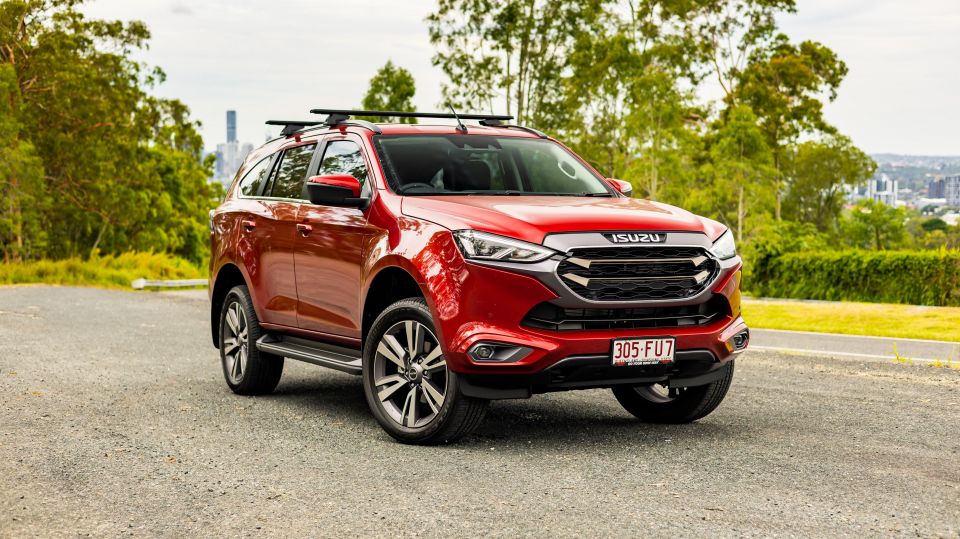
Next were Isuzu Ute (down 4.2 per cent despite the MU-X being the nation’s number one large SUV), Subaru (up 52.7 per cent), Mercedes-Benz (down 7.3 per cent), GWM including Haval (up 63.8 per cent), and BMW (up 5.2 per cent).
A few household names that battled in April were Suzuki (down 35.4 per cent), former heavyweight Honda (in 22nd spot and down in volume by 17.1 per cent), Skoda (down 16.4 per cent – unlike its fellow VW Group brands), and Jeep (down 7.7 per cent).
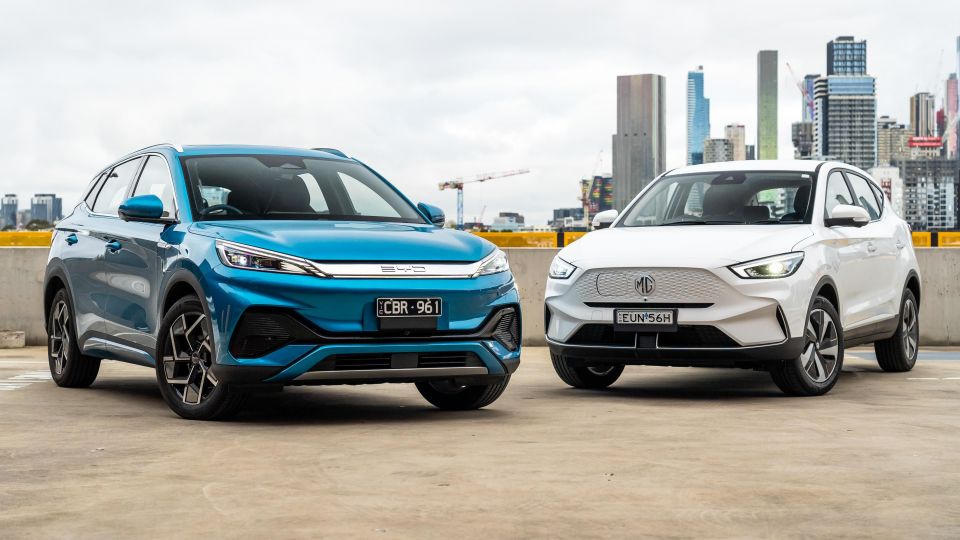
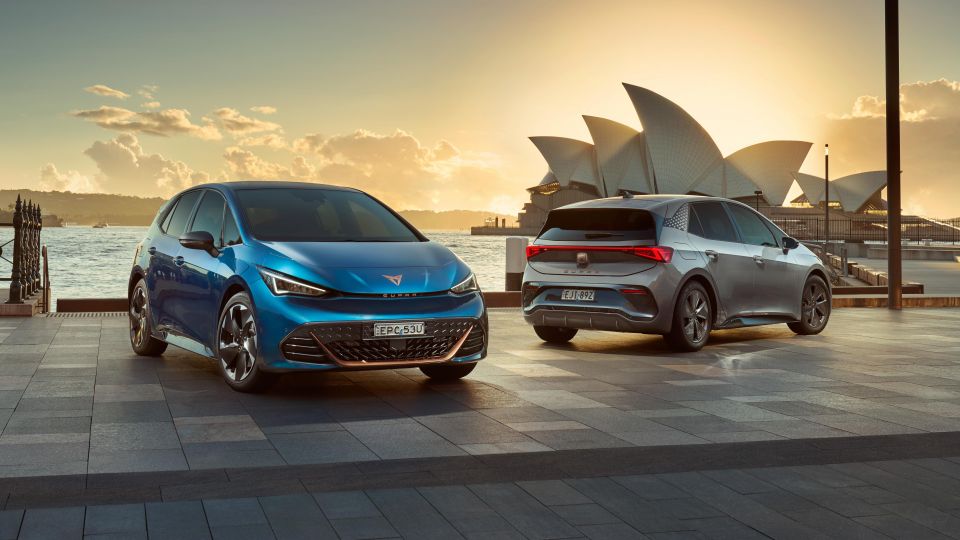
Figures for the market’s newest brands in finish order included BYD (1118 sales and a top 20 finish), Chery (425 sales from its just-launched Omoda 5 as it grows its dealer network under a factory distributor), Cupra (159 units), and Polestar (122 units).
Brand
April sales
Change %
Toyota
12,029
-33.0%
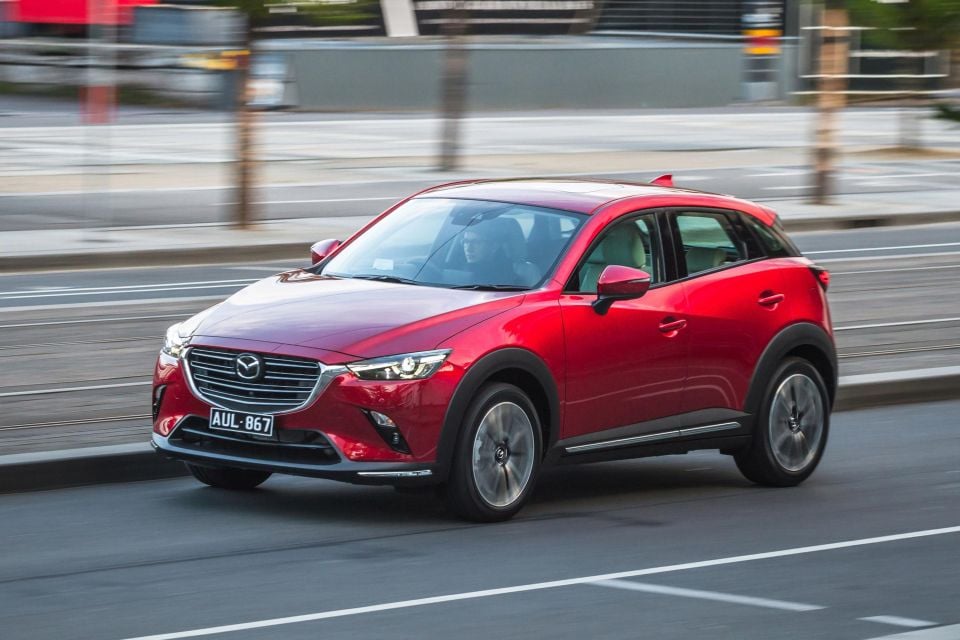
Mazda
6926
-6.1%
Kia
6200
0.3%
Hyundai
5732
3.2%
Ford
5047
1.5%
Mitsubishi
4440
-31.3%
Tesla
3676
>999%
MG
3463
-27.4%
Nissan
3009
46.8%
Volkswagen
2957
71.8%
Isuzu Ute
2904
-4.2%
Subaru
2511
52.7%
Mercedes-Benz
2487
-7.3%
GWM
2216
63.8%
BMW
1750
5.2%
LDV
1437
13.6%
Lexus
1274
130.8%
Suzuki
1153
-35.4%
BYD
1118
NA
Audi
1069
3.2%
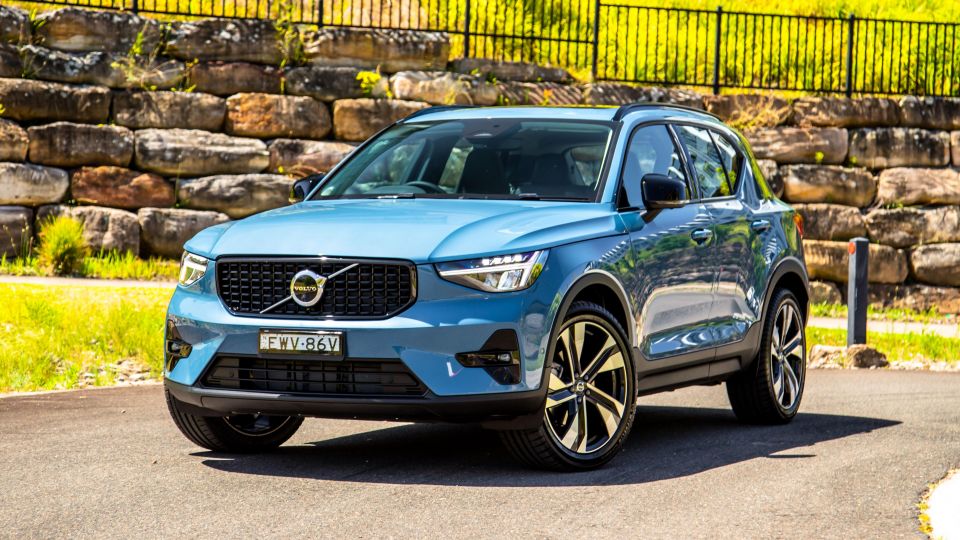
Volvo Car
1044
22.2%
Honda
889
-17.1%
Land Rover
882
50.8%
Renault
638
5.3%
Ram
581
24.7%
Skoda
498
-16.4%
SsangYong
485
195.7%
Chery
425
NA
Porsche
399
-17.0%
Jeep
348
-7.7%
Mini
238
17.8%
Chevrolet
234
30.0%
Peugeot
184
75.2%
Genesis
160
272.1%
Cupra
159
–
Fiat
143
58.9%
Polestar
122
31.2%
Maserati
58
41.5%
Jaguar
35
-62.4%
Citroen
27
17.4%
Alfa Romeo
24
-22.6%
Aston Martin
16
45.5%
Ferrari
11
-26.7%
Lamborghini
3
-66.7%
Rolls-Royce
3
-50.0%
Lotus
2
-60.0%
Alpine
0
-100.0%
Bentley
0
-100.0%
Chrysler
0
-100.0%
McLaren
0
-100.0%
Models
Below is a list of the top 20-selling nameplates, comprising a dozen different manufacturers, 12 SUVs, five utes, and three passenger cars.
Ford Ranger: 3567
Toyota HiLux: 3526
Toyota RAV4: 2198
Tesla Model Y: 2095
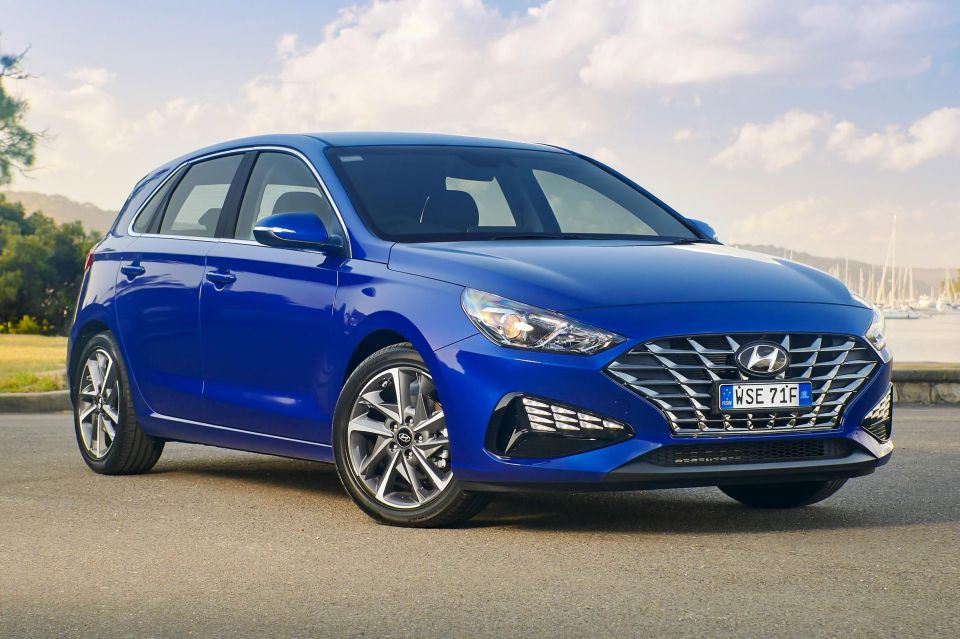
Hyundai i30: 2029
Mitsubishi Outlander: 1829
Isuzu D-Max: 1809
Hyundai Tucson: 1678
MG ZS: 1588
Tesla Model 3: 1581
Mazda BT-50: 1336
Mazda CX-30: 1291
Mazda CX-5: 1243
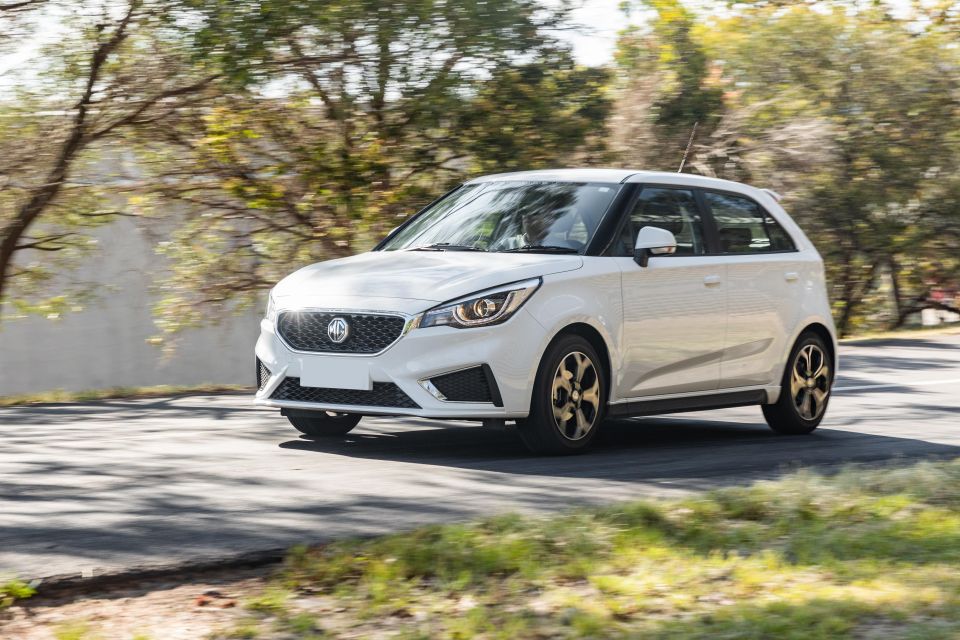
MG 3: 1141
BYD Atto 3: 1118
Isuzu MU-X: 1095
Nissan X-Trail: 1076
Kia Seltos: 998
Mitsubishi Triton: 946
Subaru Forester: 880
Segments
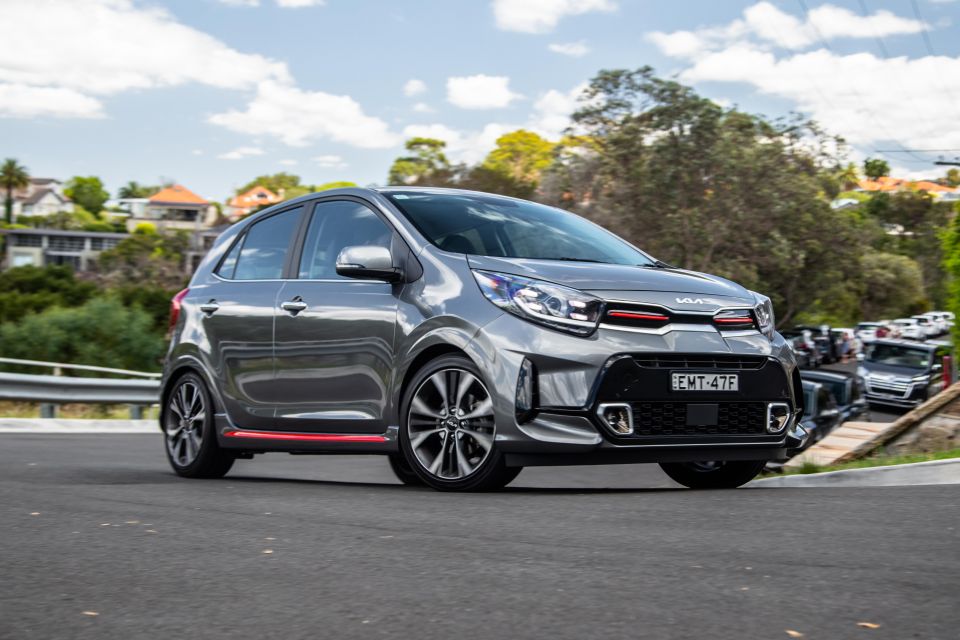
Kia Picanto
MG 3
Hyundai i30
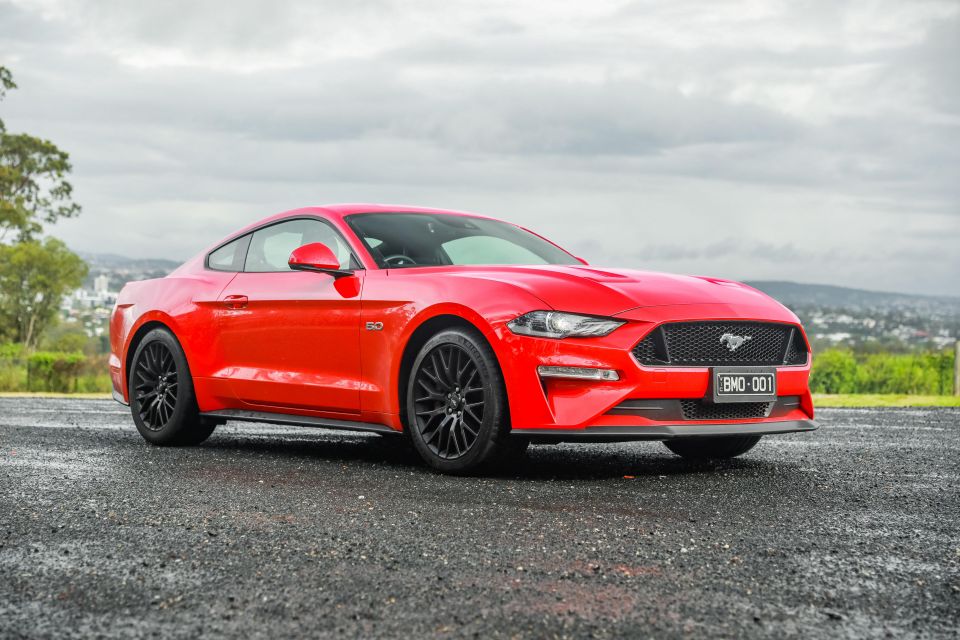
Ford Mustang
Micro Cars: Kia Picanto (617), Fiat 500 (60)
Light Cars under $30,000: MG 3 (1141), Suzuki Swift (512), Kia Rio (445)
Light Cars over $30,000: Mini (86), Skoda Fabia (33), Audi A1 (28)
Small Cars under $40,000: Hyundai i30 (2029), Mazda 3 (845), Toyota Corolla (791)
Small Cars over $40,000: Mercedes-Benz A-Class (243), Subaru WRX (176), Volkswagen Golf (137)
Medium Cars under $60,000: Toyota Camry (574), Mazda 6 (145), Skoda Octavia (97)
Medium Cars over $60,000: Tesla Model 3 (1581), BMW 3 Series (247), Mercedes-Benz C-Class (197)
Large Cars under $70,000: Kia Stinger (233), Skoda Superb (14), Citroen C5 X (10)
Large Cars over $70,000: Mercedes-Benz EQE (54), Mercedes-Benz E-Class (49), Audi e-tron GT (43)
Upper LargeCars: Mercedes-Benz S-Class (7), BMW 7 Series (5), Mercedes-Benz EQS (4)
People Movers: Kia Carnival (792), Volkswagen Multivan (82), Hyundai Staria (68)
Sports Cars under $80,000: Ford Mustang (143), Subaru BRZ (113), Toyota 86 (78)
Sports Cars over $80,000: Mercedes-Benz C-Class (82), BMW 4 Series (39), Chevrolet Corvette (28)
Sports Cars over $200,000: Porsche 911 (28), Ferrari range (11), Aston Martin two-door range (9)