
Ben Zachariah
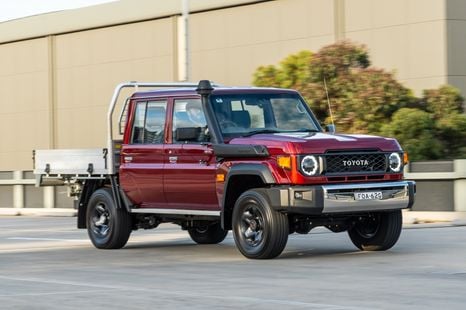
2026 Toyota LandCruiser 79 Series GXL Double-Cab review
The 70 Series dual-cab remains a popular choice among certain groups of buyers, but is it still relevant in the competitive ute segment?
6 Hours Ago
Car sales tumbled 20 per cent during the first half of 2020, over last year's figure, and hit their lowest ebb since way back in 2002. Let's take a dive into the data...

Senior Contributor
Senior Contributor
We’ve now passed the halfway point of 2020, meaning we can get a clearer idea of how Australia’s new car market is holding up.
Between bushfires and COVID-19, it has been a year defined by challenges. So the fact sales have dipped further compared to 2019’s total shouldn’t come as a surprise.
VFACTS data compiled by the Federal Chamber of Automotive Industries (FCAI) shows sales of new vehicles declined by 20.2 per cent over the first half (H1) of 2020.
At the end of H1, 442,415 new vehicles were counted as sold, against 554,466 in H1 last year. It’s the lowest H1 total for the Australian market since 2002.
| Year | H1 sales |
|---|---|
| 2020 | 442,415 |
| 2019 | 554,466 |
| 2018 | 605,522 |
| 2017 | 599,522 |
| 2016 | 598,140 |
| 2015 | 578,427 |
| 2014 | 556,951 |
| 2013 | 573,711 |
| 2012 | 547,854 |
| 2011 | 496,236 |
| 2010 | 531,168 |
| 2009 | 455,233 |
| 2008 | 542,695 |
| 2007 | 524,376 |
| 2006 | 483,160 |
| 2005 | 498,967 |
| 2004 | 473,516 |
| 2003 | 443,203 |
| 2002 | 406,966 |

There have been 27 successive months of decreasing sales in the industry, relative to the corresponding month in the previous year.
H1 sales declined across every region bar the ACT, where they grew by 26.6 per cent. One explainer is that a hail storm reportedly caused a large number of vehicle write-offs across the nation’s capital, leading to a new sales windfall.
The biggest drop belonged to Victoria, where sales declined 24.2 per cent during H1, equal to 38,194 fewer cars being sold against 2019’s tally. The dip in New South Wales was 20.8 per cent (36,996 cars), and in Queensland the falls were 19.4 per cent (22,123 units).
Sales in Western Australia tumbled 13.5 per cent (6326 units), in South Australia 19.6 per cent (6846 units), in Tasmania by 25.8 per cent (2434 units), and in the Northern Territory 29 per cent (1439 sales).
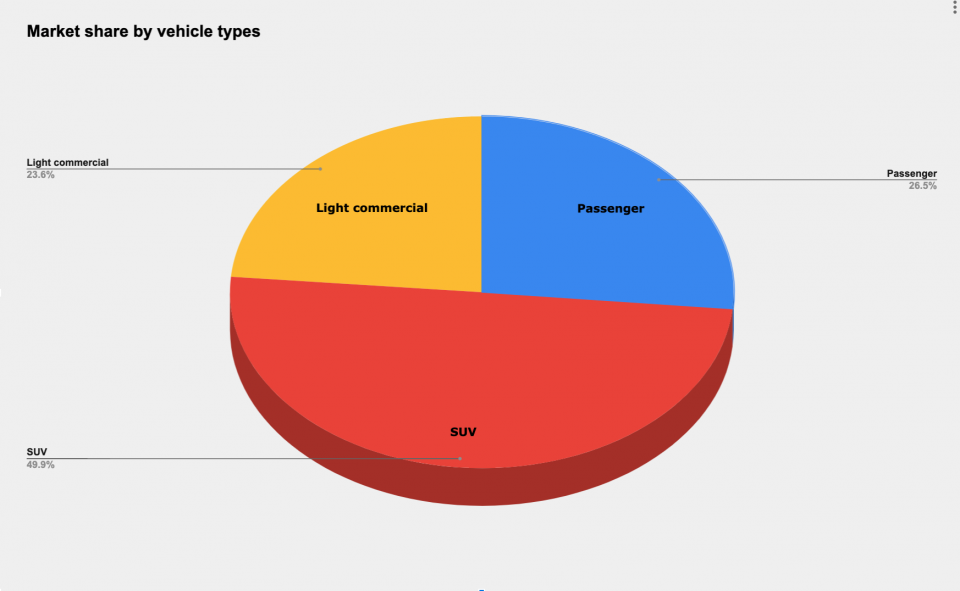
Sales of passenger cars – sedans, hatches, wagons, coupes, convertibles and people-movers – plummeted 33.9 per cent during H1. SUV sales declined 13.8 per cent, and light commercial utes and vans fell 14.9 per cent.
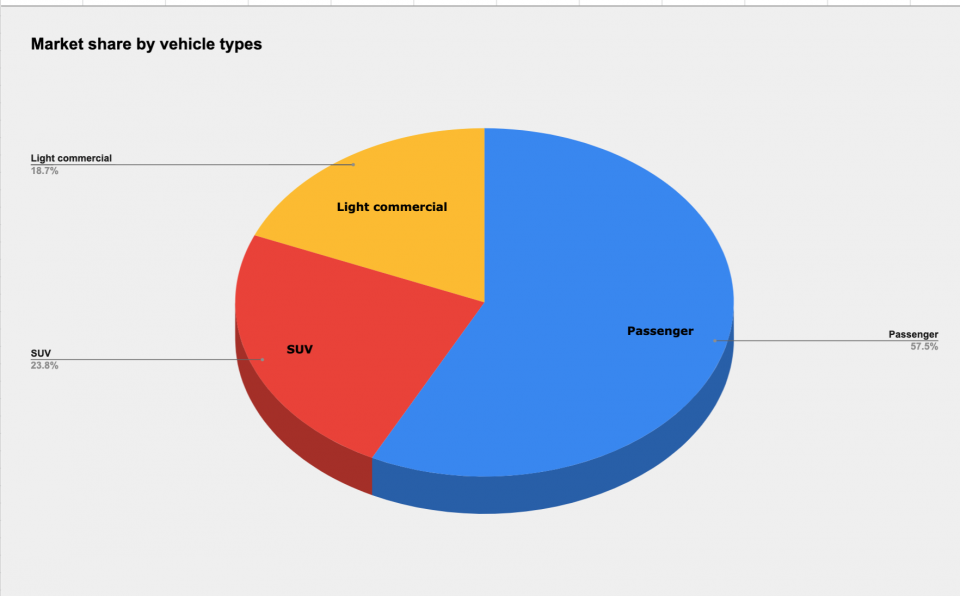
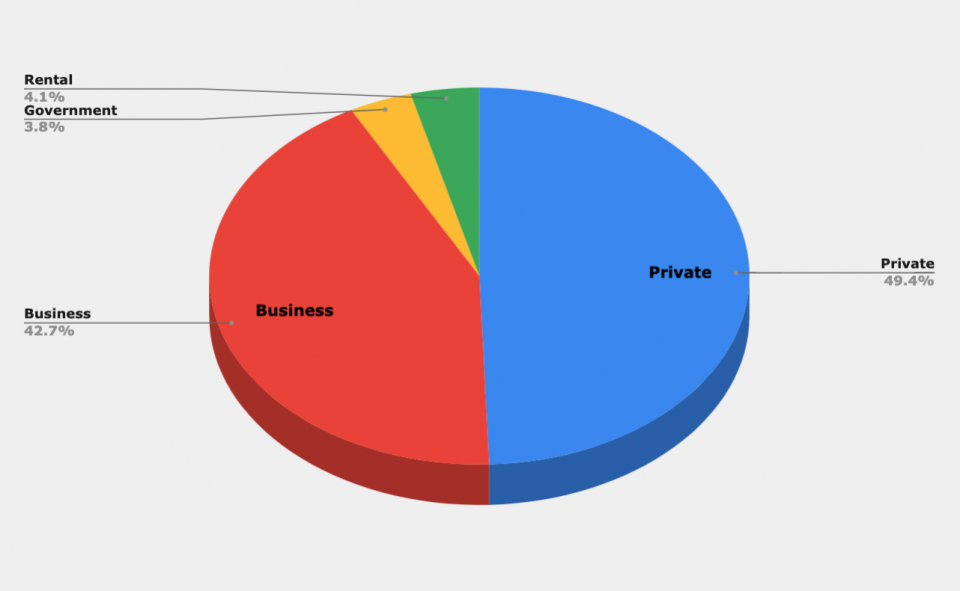
The pie charts below should give you some insights into how the market has changed over the past decade. The left graph shows the 2020 segment breakdown, whereas the right shows the 2011 breakdown, by market share.
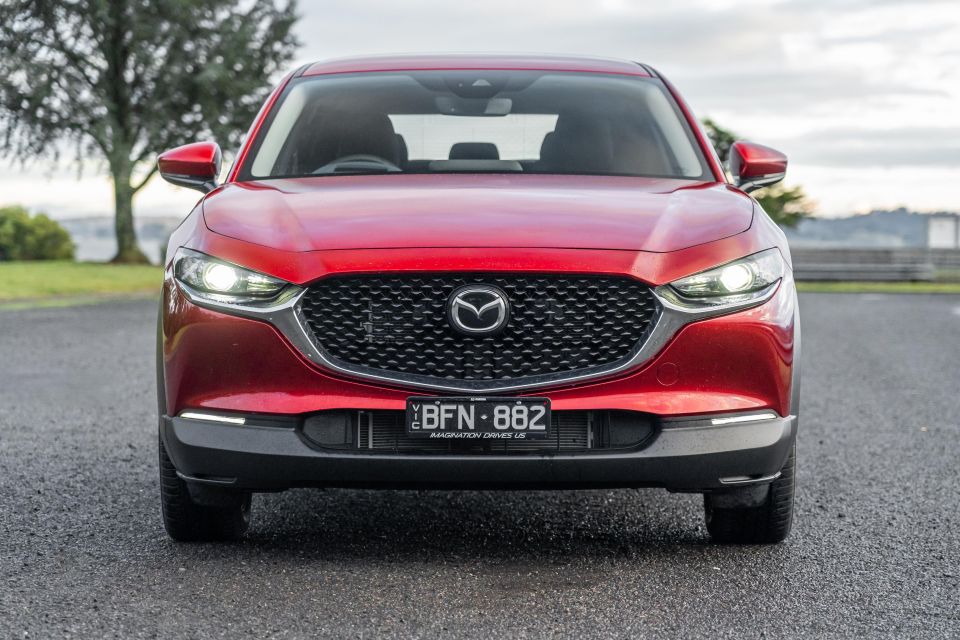
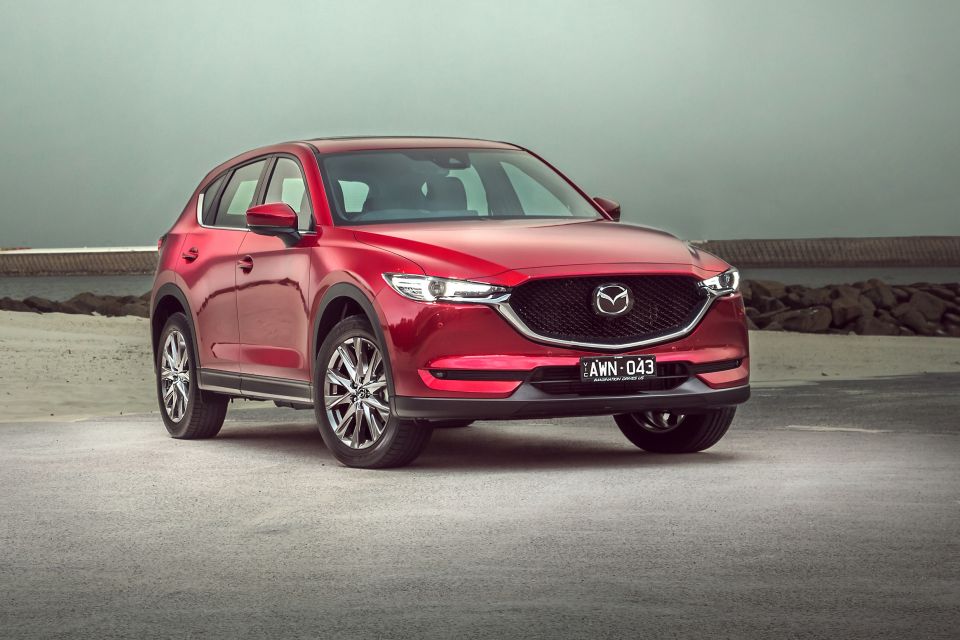
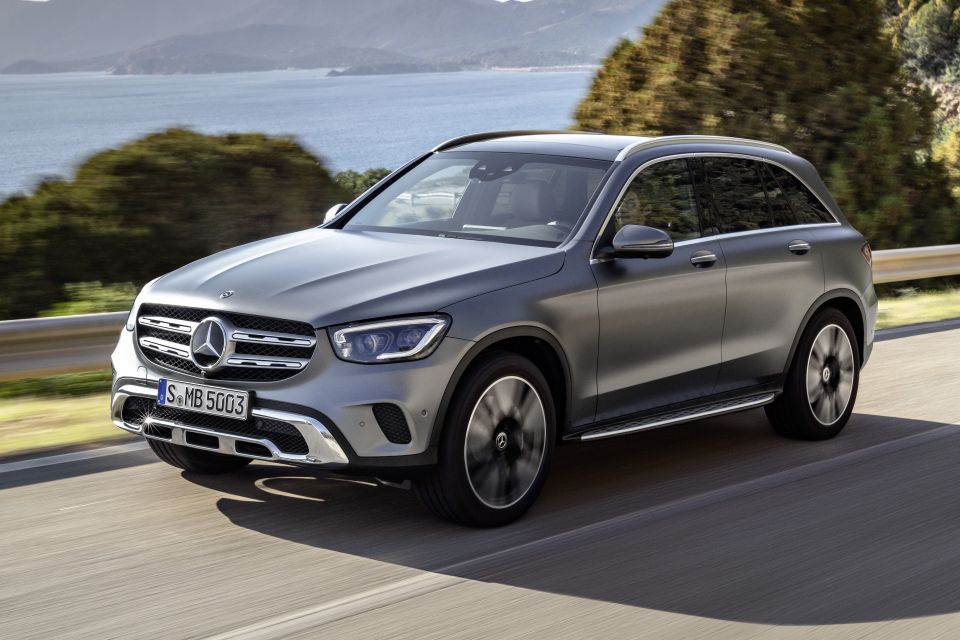
Over H1, 2020, the most popular vehicle type was medium SUV, which accounted for 19.2 per cent of the entire market. The sales leaders at the mainstream end were the Toyota RAV4 and Mazda CX-5, and at the luxury end the Mercedes-Benz GLC and BMW X3.
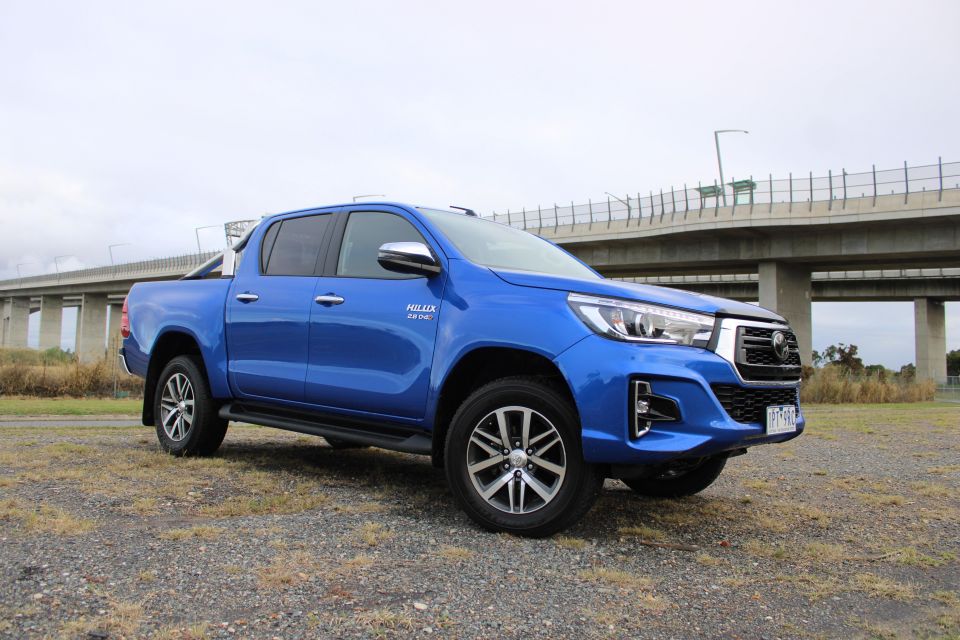
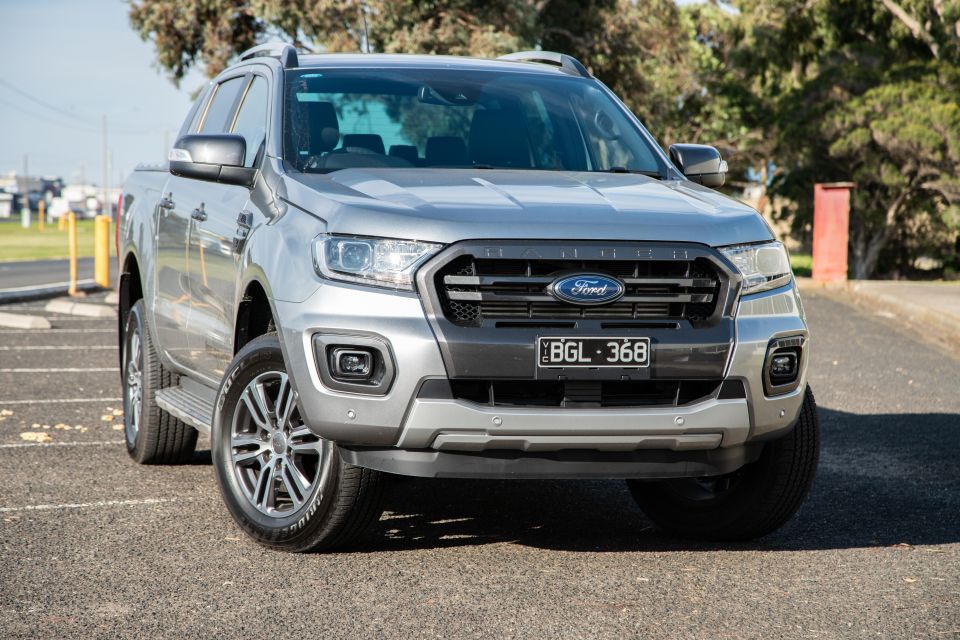
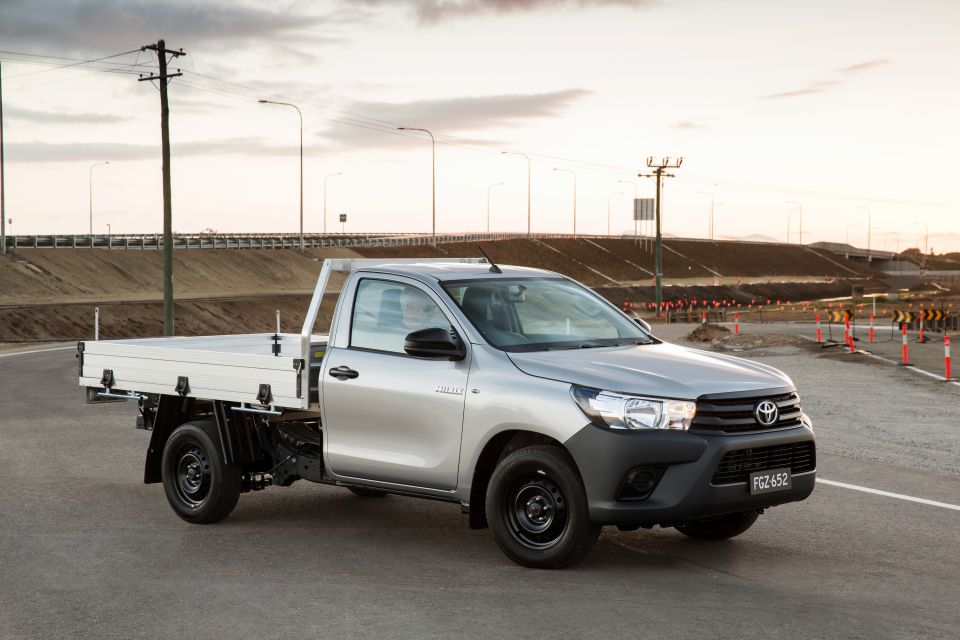
The next most-popular vehicle type were 4×4 utes led by the Ford Ranger and Toyota HiLux, with the segment accounting for 17.1 per cent share.
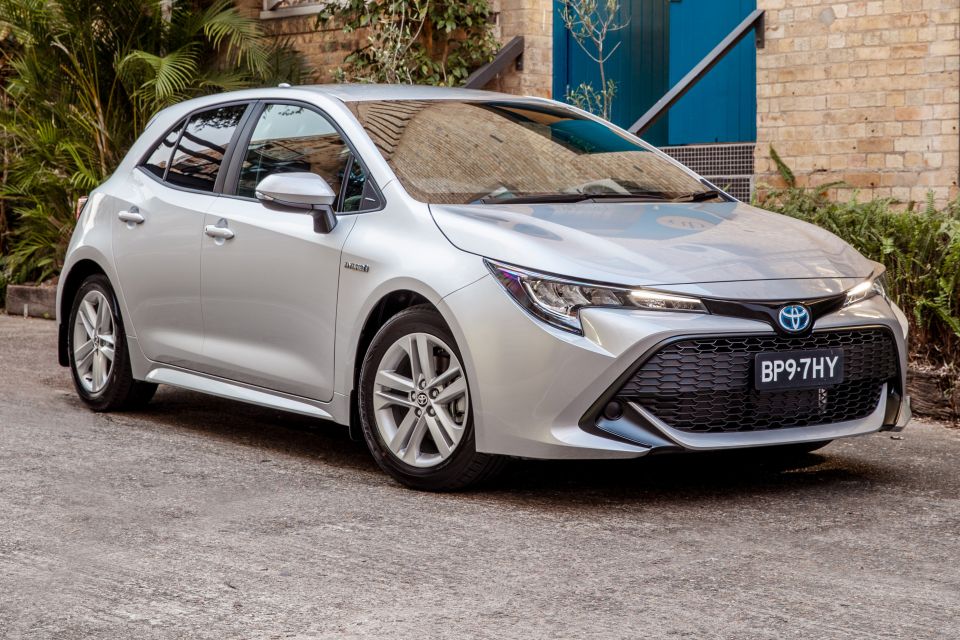
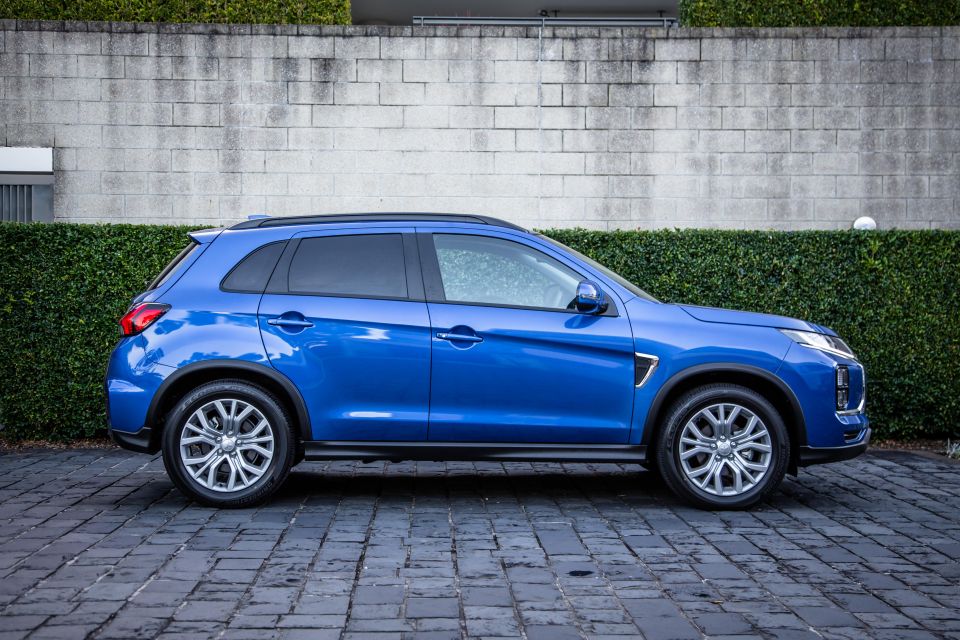
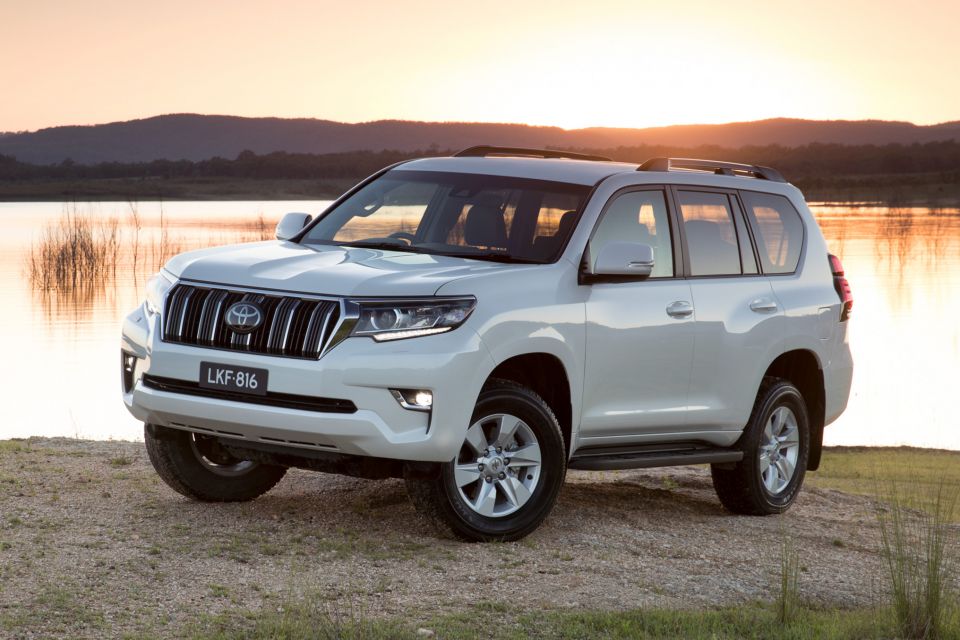
Following this were small cars (led by the Toyota Corolla and Hyundai i30) on 14.3 per cent, small SUVs (led by the Mitsubishi ASX and Hyundai Kona) with 12 per cent, and large SUVs (led by Toyota’s Prado and Kluger) with 11.8 per cent.
That means these five vehicle segments accounted for 72 per cent of all new vehicles sold.
The segments the suffered the most precipitous volume declines during H1 2020 were large cars (down 60.1 per cent), light cars (down 46 per cent) and micro cars (41.9 per cent).
Perennial market leader Toyota increased its market share, since its 6.7 per cent sales decline was below the market average. The Big T managed 22.1 per cent share, or 23.2 per cent if you include Lexus.
This table below shows the sales of each car brand over H1, 2020, and the change compared to the same period during 2019.
| Brand | H1 2020 | Change % |
|---|---|---|
| Toyota | 97,279 | -6.7 |
| Mazda | 38,847 | -29.8 |
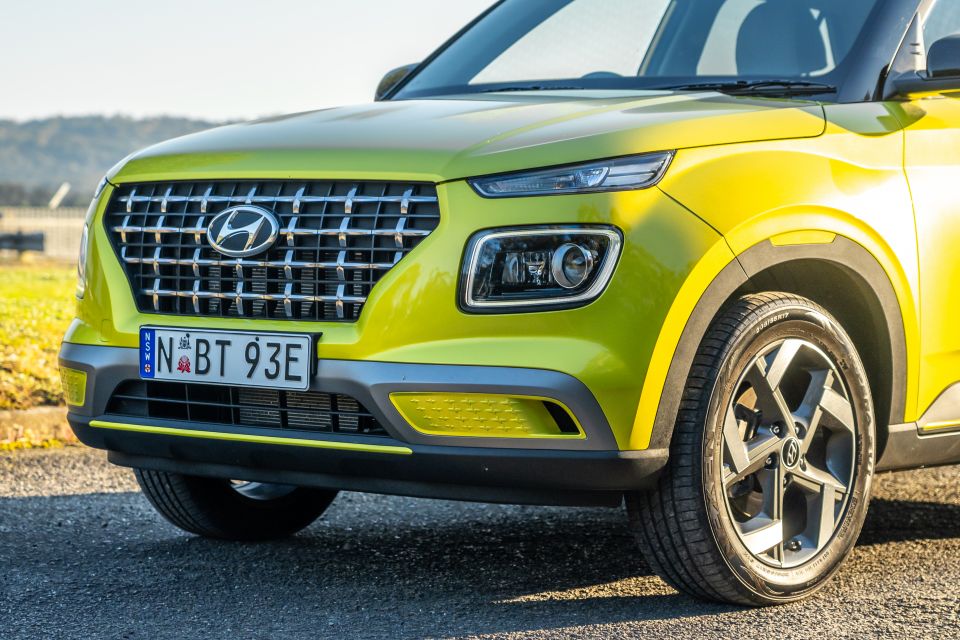
| Hyundai | 30,787 | -31.5 |
| Mitsubishi | 28,786 | -34.6 |
| Ford | 27,651 | -18.7 |
| Kia | 26,458 | -17.5 |
| Volkswagen | 19,595 | -25.2 |
| Nissan | 18,693 | -26.3 |
| Mercedes-Benz | 17,683 | -7.5 |
| Honda | 16,529 | -33.4 |
| Subaru | 14,957 | -25.7 |
| Holden | 14,102 | -42.5 |
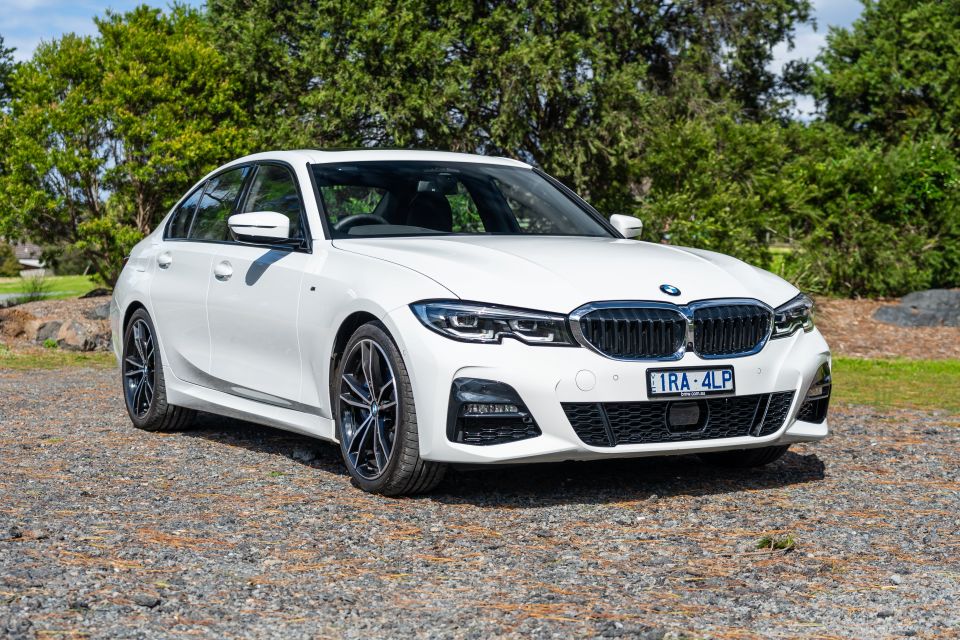
| BMW | 12,580 | +1.6 |
| Isuzu Ute | 9979 | -21.2 |
| Audi | 7229 | +0.4 |
| Suzuki | 7163 | -21.3 |
| MG | 5742 | +54.4 |
| Lexus | 4740 | -1.4 |
| Land Rover | 3739 | -27.8 |
| Volvo Car | 3370 | -11.9 |
| LDV | 3163 | +3.5 |
| Skoda | 2752 | -20.8 |
| Renault | 2621 | -33.4 |
| Jeep | 2325 | -20.9 |
| Porsche | 2227 | -2.9 |
| RAM | 1727 | +54.6 |
| Mini | 1549 | -9.4 |
| Haval | 1270 | +97.5 |
| Peugeot | 955 | -8.9 |
| Jaguar | 871 | -33.0 |
| Great Wall | 824 | +23.4 |
| Fiat | 681 | -48.0 |
| SsangYong | 656 | New brand |
| Alfa Romeo | 286 | -36.2 |
| Maserati | 231 | -16.3 |
| Infiniti | 197 | -37.5 |
| Chrysler | 136 | -22.3 |
| Ferrari | 110 | -9.1 |
| Citroen | 98 | -55.7 |
| Bentley | 91 | -13.3 |
| Genesis | 63 | +65.8 |
| Lamborghini | 54 | -42.6 |
| Aston Martin | 40 | -33.3 |
| McLaren | 30 | -41.2 |
| Lotus | 28 | -12.5 |
| Rolls-Royce | 18 | -30.8 |
You’ll notice in red those brands that grew their sales volume: BMW and Audi relished having new products, while entry Chinese brands MG, LDV, Great Wall and Haval all climbed.
MG in particular is becoming a notable player.
Australia’s importer of Ram Trucks, Ateco, which licenses Walkinshaw to convert pickups to right-hand drive in Melbourne, grew 54 per cent. New entrant from Korea, SsangYong, added incremental volume, while Genesis grew its modest figures.
The following list shows the 30 most popular new vehicles.
| Model | Sales |
|---|---|
| Toyota HiLux | 22,348 |
| Ford Ranger | 18,466 |
| Toyota RAV4 | 15,544 |
| Toyota Corolla | 13,531 |
| Hyundai i30/Elantra | 11,294 |
| Mazda CX-5 | 10,219 |
| Mitsubishi Triton | 9617 |
| Kia Cerato | 8932 |
| Toyota Prado | 8632 |
| Hyundai Tucson | 7345 |
| Mazda 3 | 7235 |
| Toyota LandCruiser wagon | 6860 |
| Nissan X-Trail | 6853 |
| Mitsubishi ASX | 6794 |
| Holden Colorado | 6712 |
| Isuzu D-Max | 6606 |
| Toyota Camry | 6518 |
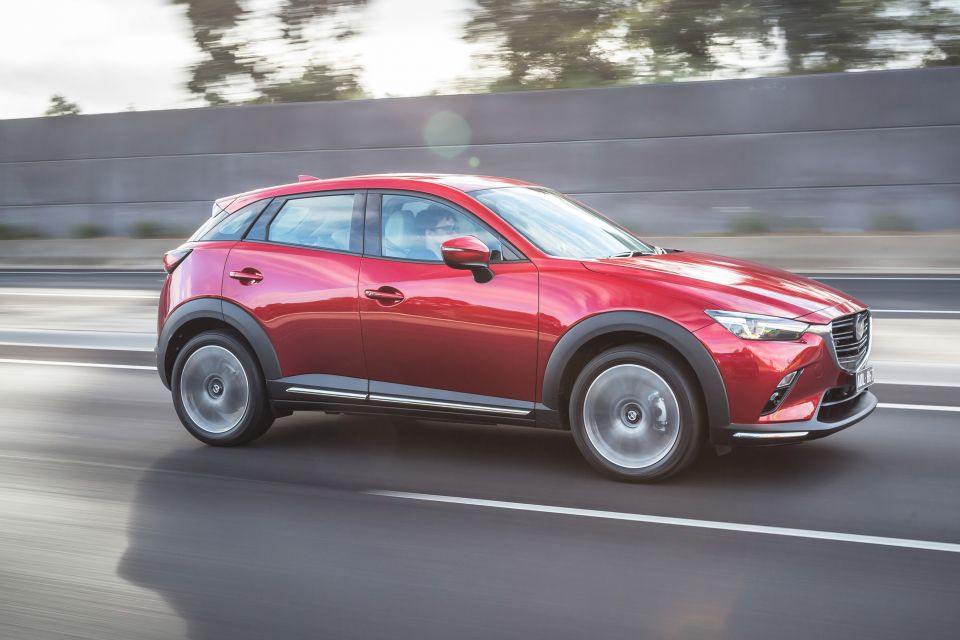
| Mazda CX-3 | 6146 |
| Volkswagen Golf | 6119 |
| Mitsubishi Outlander | 5798 |
| Subaru Forester | 5757 |
| Honda CR-V | 5613 |
| Nissan Navara | 5477 |
| Hyundai Kona | 5446 |
| Mazda BT-50 | 5231 |
| Kia Sportage | 4984 |
| Toyota LandCruiser PU/CC | 4928 |
| Toyota Kluger | 4794 |
| Honda HR-V | 4600 |
| Toyota C-HR | 4599 |
If we go by vehicle segments, we can find the sales leaders in each.
Mainstream passenger
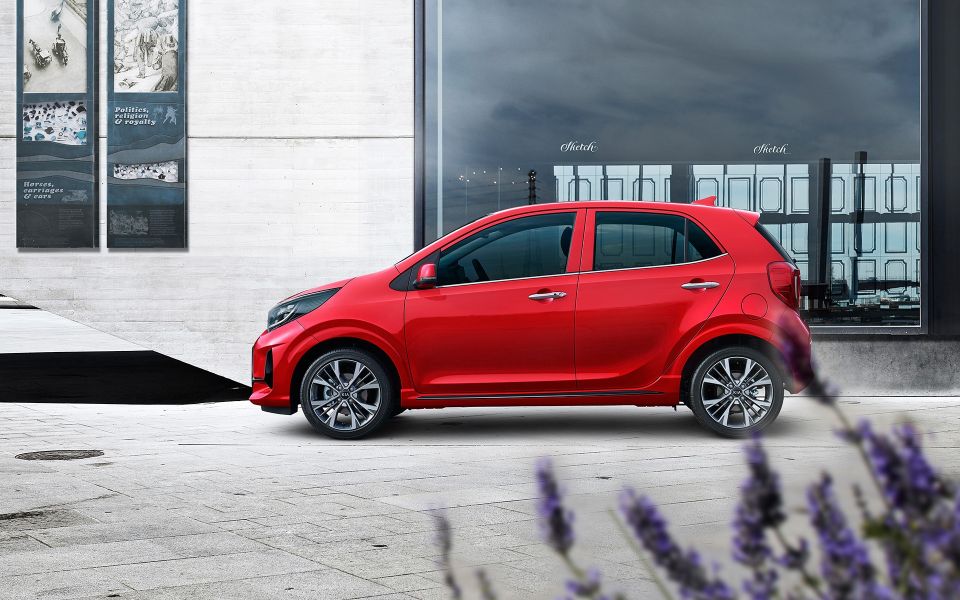
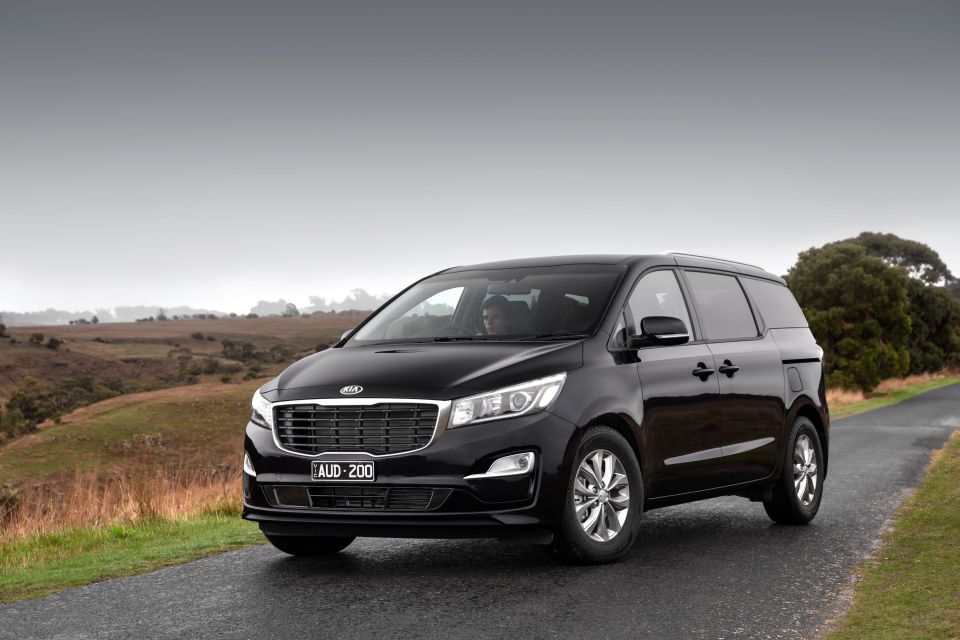
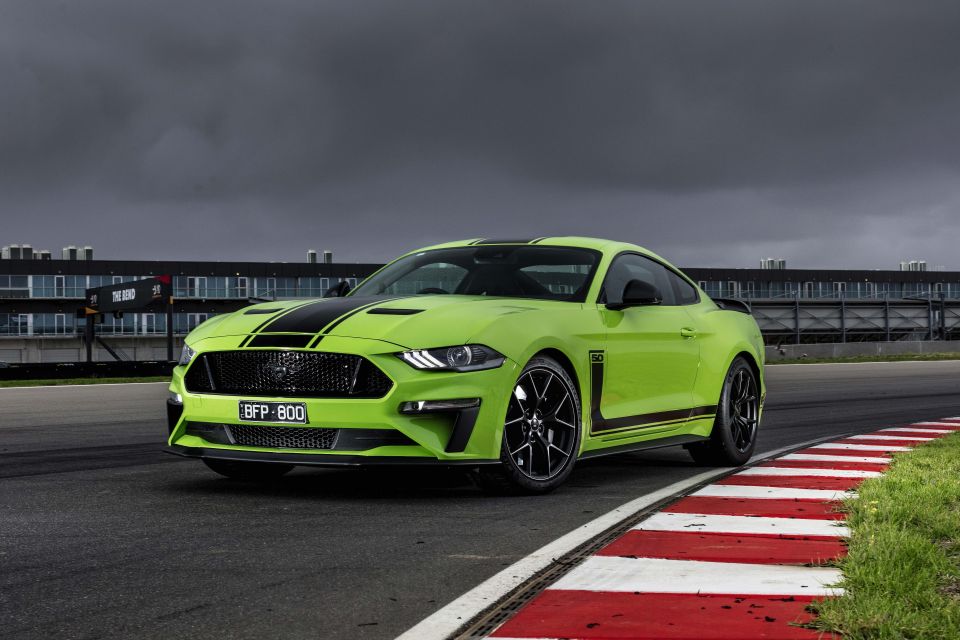
Micro: Kia Picanto (1697), Mitsubishi Mirage (298), Fiat 500 (244) Light: Toyota Yaris (3324), MG 3 (2913), Kia Rio (2688) Small: Toyota Corolla (13,531), Hyundai i30/Elantra (11,294), Kia Cerato (8932) Medium: Toyota Camry (6518), Mazda 6 (824), Skoda Octavia (780) Large: Kia Stinger (851), Holen Commodore (608), Skoda Superb (89) People Movers: Kia Carnival (2087), Honda Odyssey (581), LDV G10 (326) Sports: Ford Mustang (1603), Hyundai Veloster (260), Toyota 86 (188)
Luxury passenger
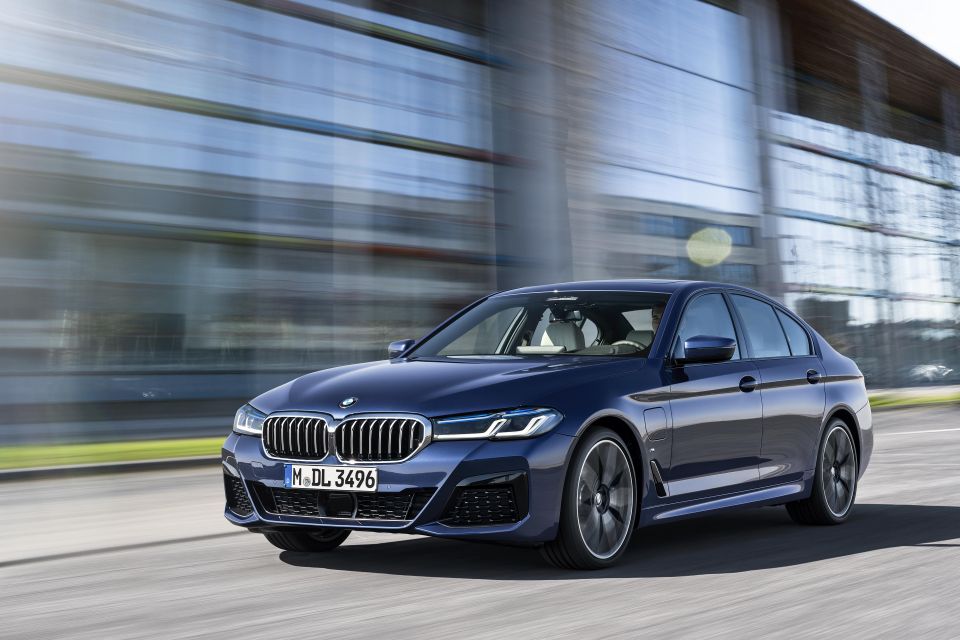
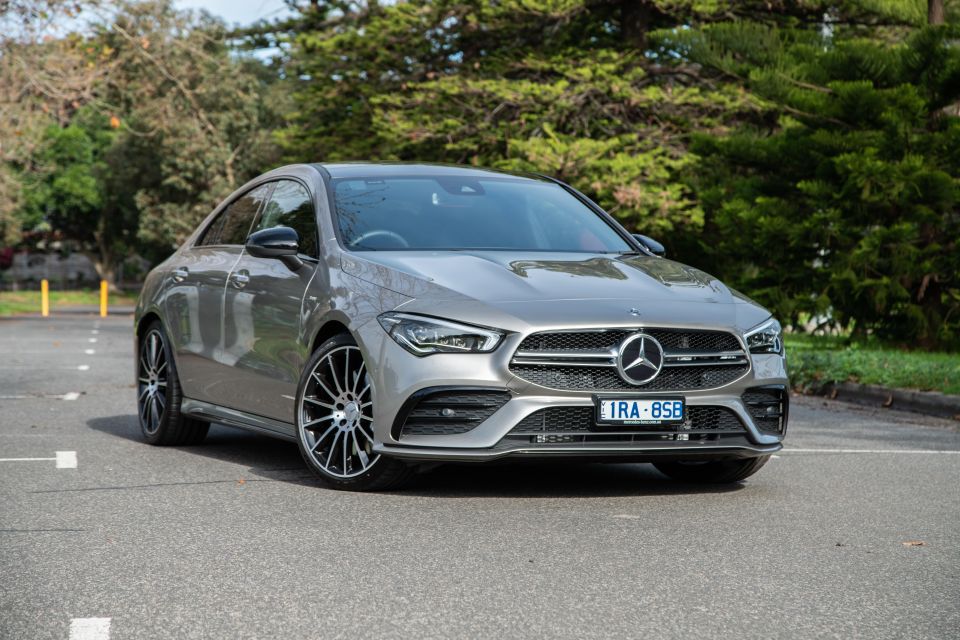
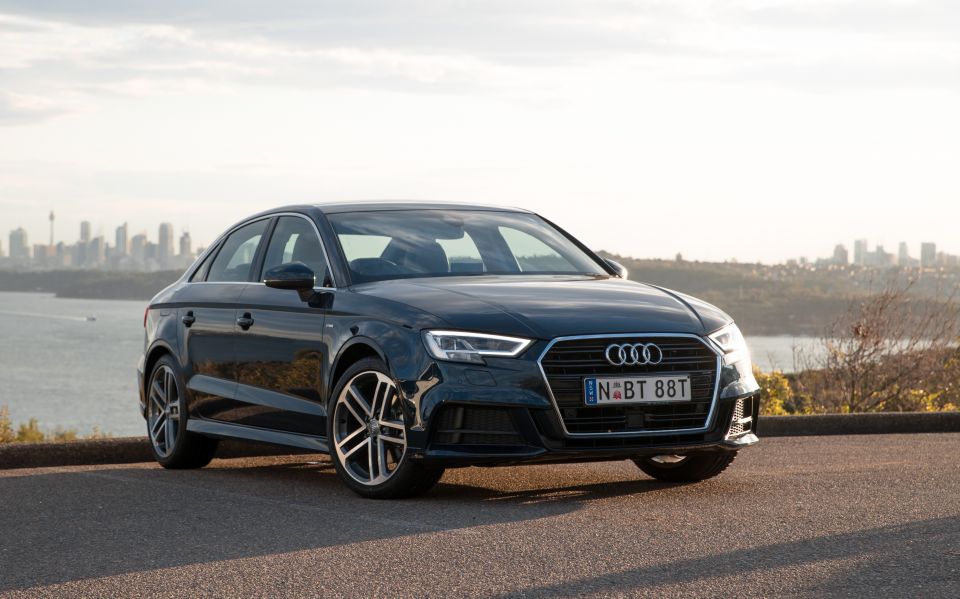
Small: Mercedes-Benz A-Class (3342), BMW 1 Series (1356), Audi A3 (1090) Medium: BMW 3 Series (1873), Mercedes-Benz C-Class (1467), Mercedes-Benz CLA (844) Large: BMW 5 Series (382), Mercedes-Benz E-Class (362), BMW 6 Series GT (94) Sports: Mercedes-Benz C-Class (655), BMW 2 Series (377), BMW 4 Series (213)
Mainstream SUV
Light: Mazda CX-3 (6146), Holden Trax (2145), Hyundai Venue (1677) Small: Mitsubishi ASX (6794), Hyundai Kona (5446), Honda HR-V (4600) Medium: Toyota RAV4 (15,544), Mazda CX-5 (10,219), Hyundai Tucson (7345) Large (soft-roader): Toyota Kluger (4794), Mazda CX-9 (2996), Hyundai Santa Fe (2469) Large (rugged): Toyota Prado (8632), Toyota LandCruiser (6860), Isuzu MU-X (3373)
Luxury SUV
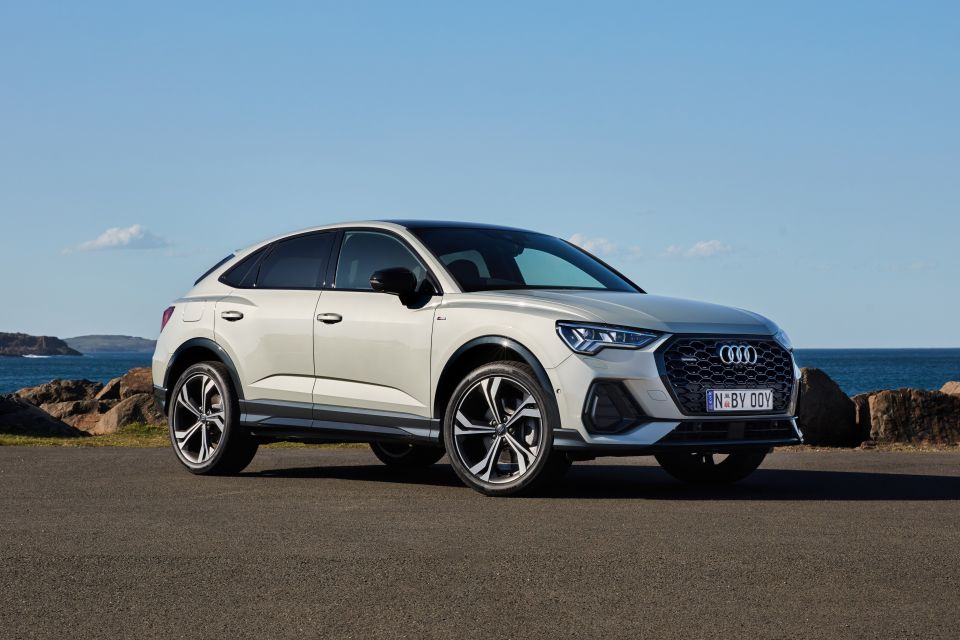
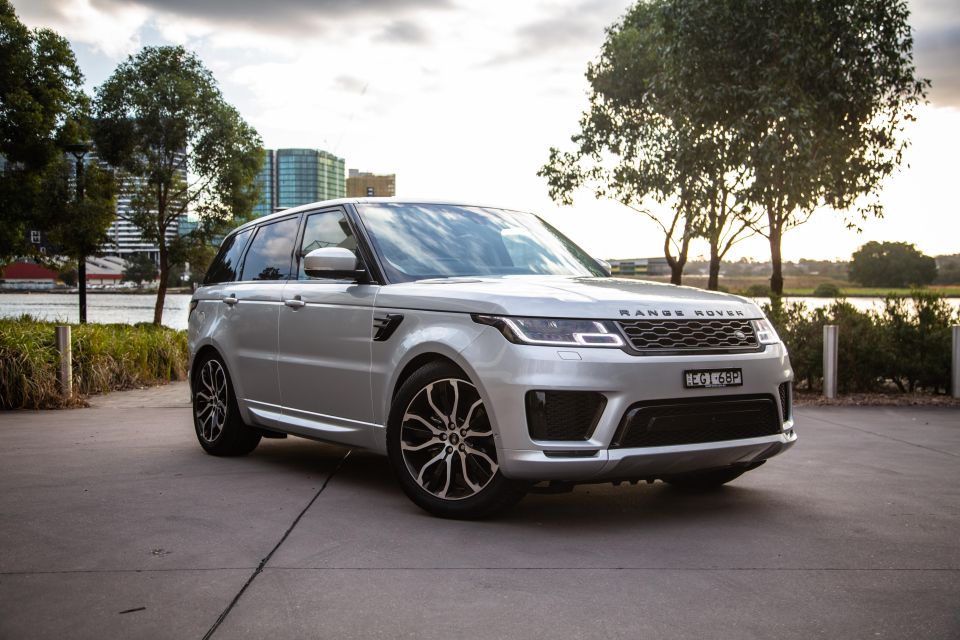
Small: Audi Q3 (1805), BMW X1 (1597), Volvo XC40 (1441) Medium: Mercedes-Benz GLC (3238), BMW X3/X4 (2959), Lexus NX (1931) Large: BMW X5/X6 (1774), Mercedes-Benz GLE (1667), Range Rover Sport (1049) Upper Large: Mercedes-Benz GLS (503), Land Rover Discovery (499), BMW X7 (445)
Light commercials
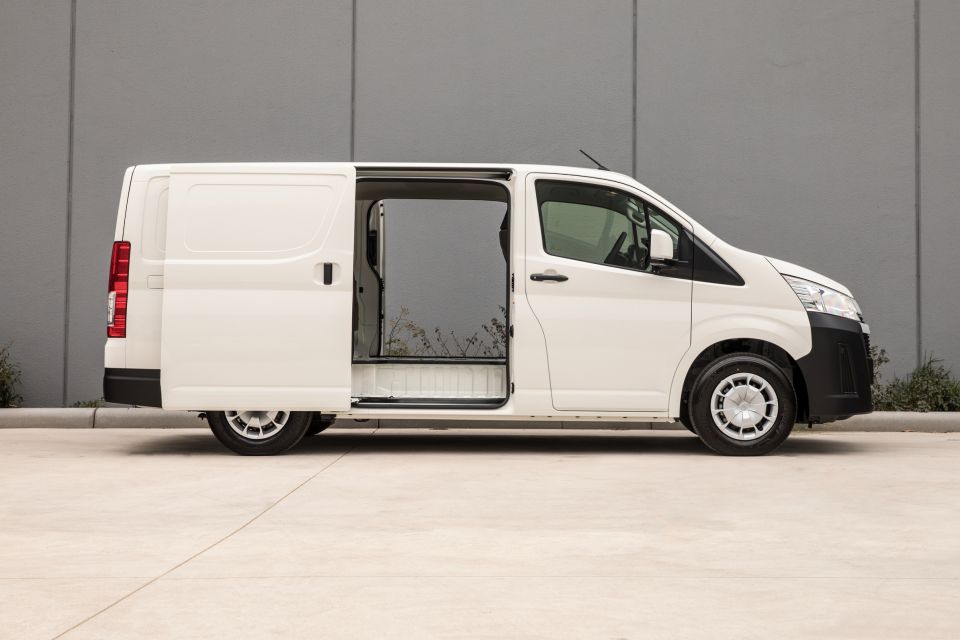
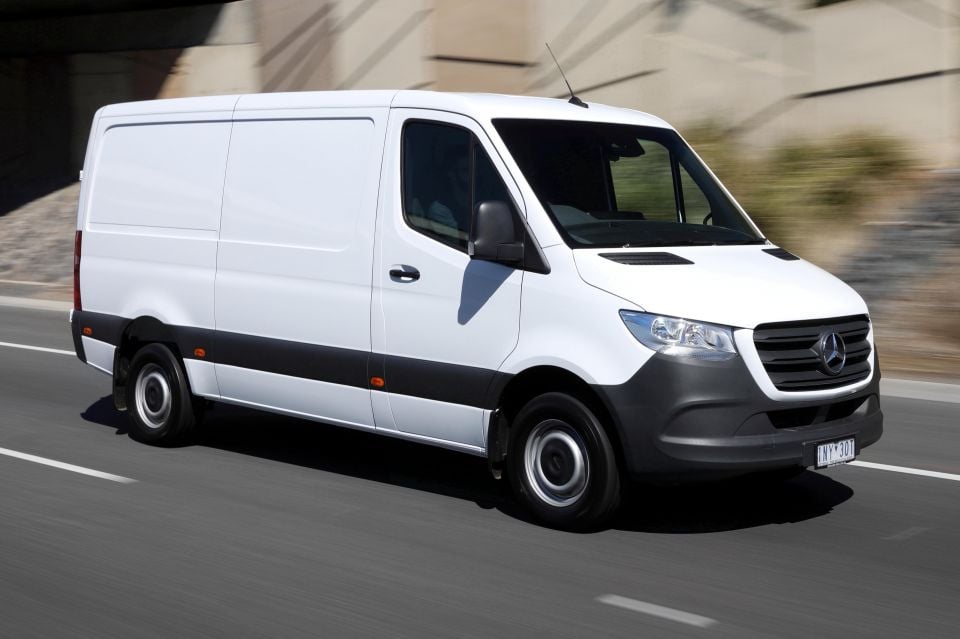
Small Vans: Volkswagen Caddy (808), Renault Kangoo (231), Peugeot Partner (75) Medium Vans: Toyota HiAce (3262), Hyundai iLoad (1666), Ford Transit Custom (1233) Large Vans: Mercedes-Benz Sprinter (1284), Ford Transit Heavy (618), Renault Master (584) 4×2 Utes: Toyota HiLux (5072), Isuzu D-Max (2011), Mazda BT-50 (1490) 4×4 Utes: Ford Ranger (17,406), Toyota HiLux (17,276), Mitsubishi Triton (8244)
Private buyer sales fell 18.9 per cent (to 210,536), business fleet sales declined 18.6 per cent (181,985), government department sales tumbled 13.5 per cent (16,006), and rental fleet sales plummeted 48.4 per cent (17,487) – not much use for them during COVID-19.
With Toyota selling huge numbers of hybrid cars (about half of all RAV4s and Corollas), the growth of petrol-electric vehicles is little surprise. Hybrid car sales this year are up 87.4 per cent to 23,235 units.
Tesla refuses to disclose its local sales, but sales of full-electric and plug-in hybrids combined excluding the Californian brand grew 19.2 per cent to 1526 units.
The top sources of imports were: Japan (141,552 cars), Thailand (110,751), Korea (58,441), Germany (31,788), the USA (18,621), China (11,055), and England (10,597).
If you have any questions – perhaps you want to know how your car did – ask in the comments and a member of the CarExpert team will respond.
Ben Zachariah
6 Hours Ago

Damion Smy
12 Hours Ago


Josh Nevett
14 Hours Ago


Marton Pettendy
17 Hours Ago
Damion Smy
17 Hours Ago

William Stopford
17 Hours Ago
Add CarExpert as a Preferred Source on Google so your search results prioritise writing by actual experts, not AI.