The Australian new vehicle market has rebounded over the first half of 2023, showing 8.2 per cent growth over the same period in 2022. It’s the strongest H1 result since 2018.
Some of the interesting developments, as the tables below will show, include:
- Number-one brand Toyota down 24 per cent in volume due to poor supply, causing its market share to tumble to 15.9 share points – well below its 20 share point benchmark.
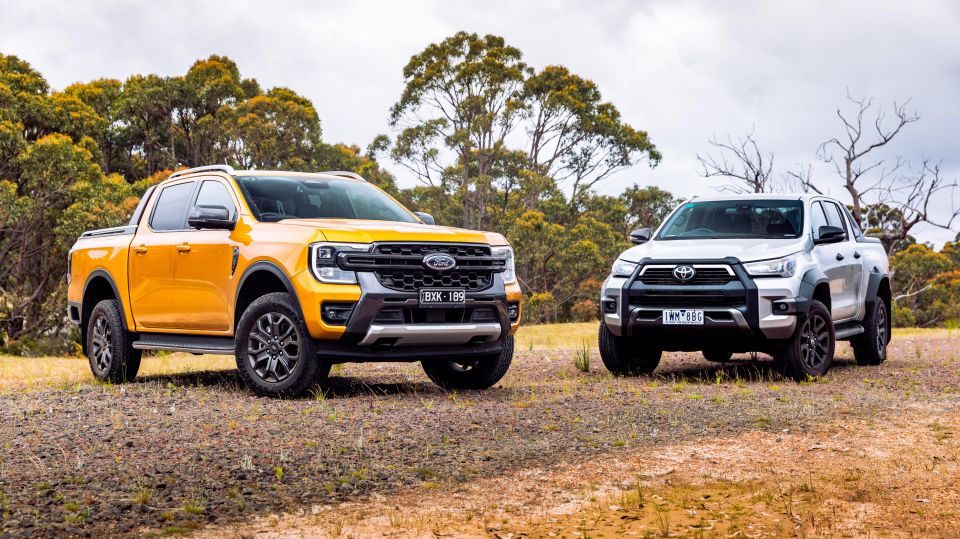
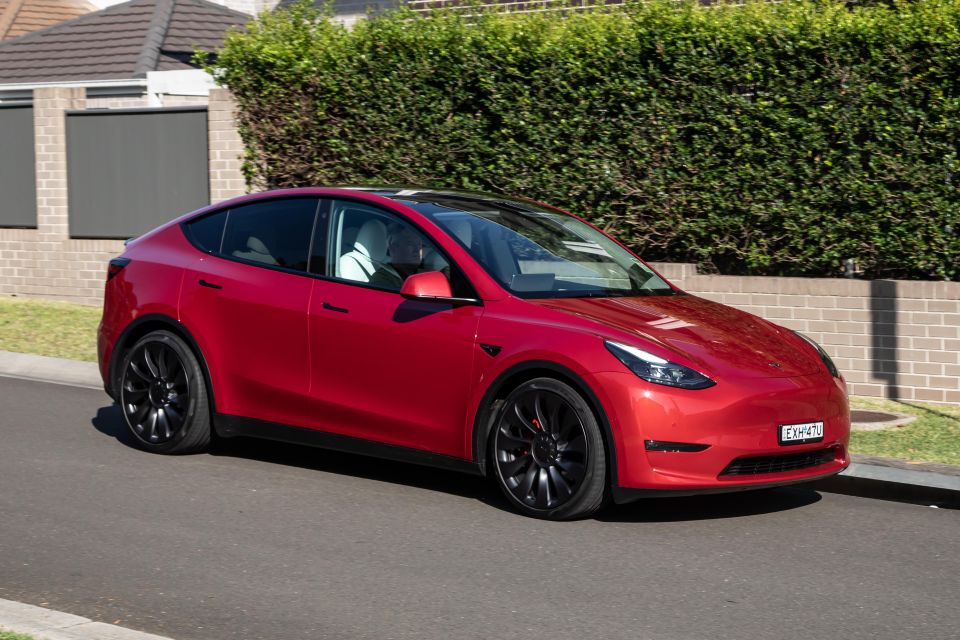
- Toyota HiLux and Ford Ranger remain the top two models, with the Isuzu D-Max in fourth. Number three vehicle YTD is the Tesla Model Y.
- Western Australia and Queensland are the two fastest-growing regions on a percentage basis.
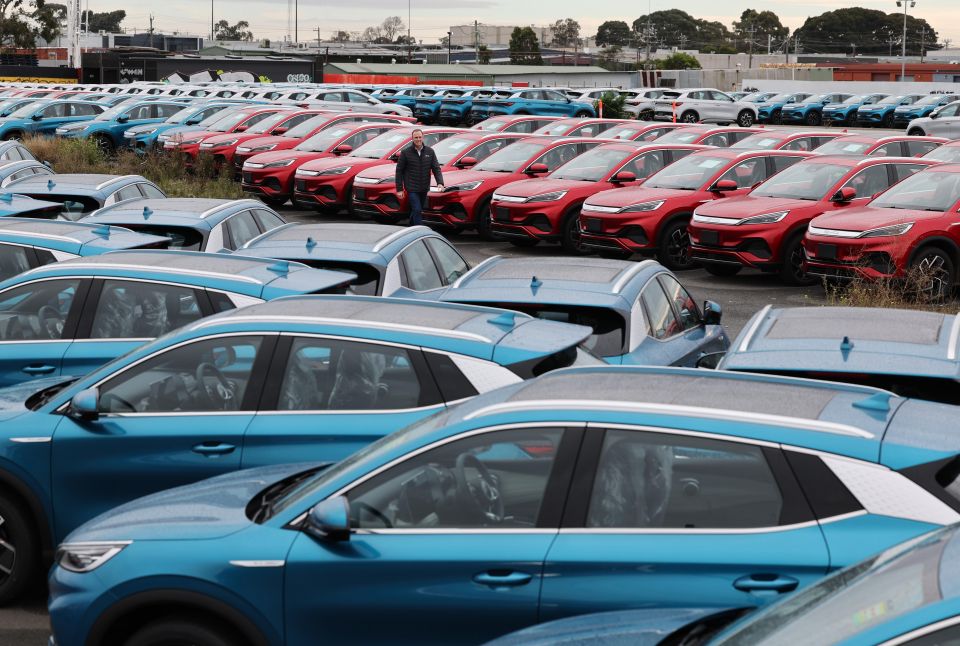
- More than 43,000 electric vehicles sold, for a record 7.4 per cent market share. It was just 1.8 per cent at this point last year!
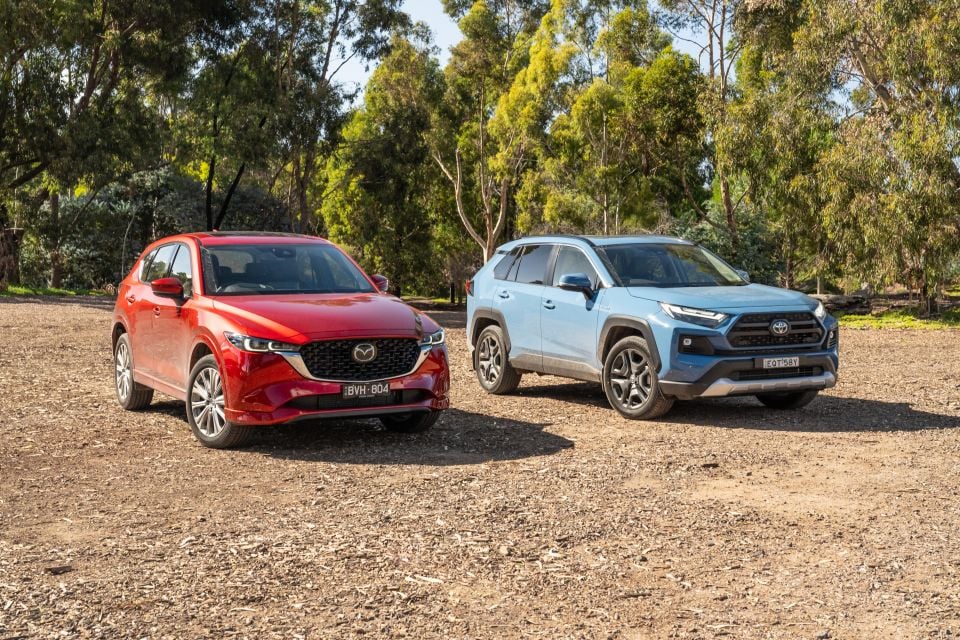
- EVs outsold hybrids (38,313), largely due to Toyota’s lack of supply on RAV4, Camry and others.
- Chinese cars up 93.1 per cent to 95,852 units, led by the Tesla Model Y and Model 3, plus domestic brands MG, GWM, LDV and BYD.
First half of each year sales:
- H1 of 2023: 581,759 units
- H1 of 2022: 537,858 units
- H1 of 2021: 567,468 units
- H1 of 2020: 442,415 units
- H1 of 2019: 554,466 units
- H1 of 2018: 605,522 units
- H1 of 2017: 599,552 units
- H1 of 2016: 598,140 units
- H1 of 2015: 578,427 units
- H1 of 2014: 559,950 units
Brands
Toyota is well ahead of Mazda in first but will need to get a wriggle on over the second half it it wants to pass 200,000 units – as its internal targets demand.
Kia (third) remains ahead of big brother Hyundai (fifth), with Ford sitting in between.
Mitsubishi is battling to get supply and its core Triton is nearing replacement, so its 26 per cent decline makes some sense. But still a poor result.
MG and Tesla demonstrate the changing dynamic, both making the top 10, ahead of Subaru and Volkswagen. GWM (including Haval) is getting closer…
VW, benefitting from better European supply than in previous years, is managing to grow its sales by 61 per cent from a low base.
There are some new entrants that have joined the market since this point in 2022, including BYD, Chery and Cupra.
List of sales by brand over H1 of 2023:
| BRAND | YTD SALES | CHANGE OVER H1 2022 |
|---|
| Toyota | 92,235 | Down 24% |
| Mazda | 50,424 | Up 1% |
| Kia | 39,160 | Down 0.7% |
| Ford | 38,182 | Up 33.7% |
| Hyundai | 37,707 | Down 1.2% |
| Mitsubishi | 30,849 | Down 26.1% |
| MG | 26,692 | Up 8.9% |
| Tesla | 25,577 | Up 449.7% |
| Subaru | 22,502 | Up 32.4% |
| Volkswagen | 20,970 | Up 60.6% |
| Isuzu Ute | 20,357 | Up 8.3% |
| GWM | 17,548 | Up 105.1% |
| Nissan | 17,278 | Up 13.3% |
| Mercedes-Benz Cars | 12,671 | Down 12.3% |
| BMW | 12,502 | Up 5.1% |
| LDV | 11,250 | Up 56.8% |
| Audi | 9336 | Up 48% |
| Suzuki | 8814 | Down 21.6% |
| Lexus | 6910 | Up 75.5% |
| Honda | 6758 | Down 11.3% |
| Volvo Car | 6290 | Up 9% |
| BYD | 6196 | New to market |
| Renault | 4425 | Down 12.7% |
| Ram | 4156 | Up 61.6% |
| Skoda | 3967 | Up 20.7% |
| Land Rover | 3714 | Up 42.8% |
| SsangYong | 3319 | Up 130% |
| Porsche | 3231 | Up 2.2% |
| Jeep | 2669 | Down 22.3% |
| Mercedes-Benz Vans | 2418 | Up 23.7% |
| Mini | 2136 | Up 30.5% |
| Chevrolet | 1713 | Up 70.8% |
| Chery | 1612 | New to market |
| Cupra | 1586 | New to market |
| Peugeot | 1186 | Up 17.3% |
| Polestar | 1147 | Up 104.1% |
| Genesis | 871 | Up 88.1% |
| Fiat Professional | 595 | Up 77.1% |
| Fiat | 413 | Up 39.1% |
| Maserati | 319 | Up 1.9% |
| Alfa Romeo | 267 | Down 9.5% |
| Jaguar | 238 | Down 42.4% |
| Citroen | 116 | Down 32.6% |
| Bentley | 110 | Down 7.6% |
| Ferrari | 105 | Down 0.9% |
| Aston Martin | 87 | Up 27.9% |
| Lamborghini | 71 | Up 61.4% |
| Lotus | 52 | Down 16.1% |
| McLaren | 46 | Up 64.3% |
| Rolls-Royce | 21 | Down 36.4% |
Models
The list of top 25-selling models looks different this year, although the top two (HiLux and Ranger) are familiar leaders.
The Tesla Model Y (third) and Model 3 (eighth) both top their segments regardless of fuel type, the Isuzu MU-X is the new top-selling large SUV (ahead of the Toyota Prado), the new BYD Atto 3 EV already sits in 22nd place, and the Kia Carnival pushed the Mazda 3 outside the top 25.
- Toyota HiLux: 28,093
- Ford Ranger: 26,741
- Tesla Model Y: 14,002
- MG ZS: 13,579
- Toyota RAV4: 13,523
- Isuzu D-Max: 13,243
- Mazda CX-5: 11,607
- Tesla Model 3: 11,575
- Mitsubishi Outlander: 11,342
- Hyundai i30: 11,214
- Hyundai Tucson: 10,749
- Mazda BT-50: 9605
- Mitsubishi Triton: 8725
- MG 3: 8449
- Subaru Forester: 8321
- Mazda CX-3: 8030
- Toyota Corolla: 7206
- Isuzu MU-X: 7114
- Toyota Prado: 7044
- Kia Sportage: 6584
- Toyota Landcruiser Wagon: 6541
- BYD Atto 3: 6196
- Mazda CX-30: 6098
- Subaru Outback: 6056
- Kia Carnival: 5745
Leaders in key markets
- Light Cars: MG 3 (8449), Suzuki Swift (3308), Kia Picanto (3271)
- Small Cars: Hyundai i30 (11,214), Toyota Corolla (7206), Mazda 3 (4842)
- Medium cars: Tesla Model 3 (11,575), Toyota Camry (3658), Mercedes-Benz C-Class (1840)
- Sports cars: Ford Mustang (1232), Subaru BRZ (838), BMW 2 Series (485)
- Light SUVs: Mazda CX-3 (8030), Kia Stonic (3953), Hyundai Venue (3266)
- Small SUVs: MG ZS (13,579), Mazda CX-30 (6098), Haval Jolion (5523)
- Medium SUVs: Tesla Model Y (14,002), Toyota RAV4 (13,523), Mazda CX-5 (11,607)
- Large SUVs: Isuzu MU-X (7114), Toyota Prado (7004), Subaru Outback (6056)
- 4×4 Utes: Ford Ranger (23,620), Toyota HiLux (21,808), Isuzu D-Max (10,787)
Miscellaneous YTD
Sales by region
- New South Wales: 177,889, up 4.7 per cent
- Victoria: 153,714, up 8.3 per cent
- Queensland: 127,960, up 11.3 per cent
- Western Australia: 60,924, up 14.8 per cent
- South Australia: 37,676, up 7.2 per cent
- Tasmania: 9,435, down 0.5 per cent
- Australian Capital Territory: 9,054, up 11.2 per cent
- Northern Territory: 5,107, down 1.7 per cent
Category breakdown
- SUV: 55.4 per cent share
- Light commercials: 22.2 per cent share
- Passenger cars: 17.9 per cent share
- Heavy commercials: 4.6 per cent share
Top segments by market share
- Medium SUV: 22.4 per cent share
- 4×4 Utes: 16.3 per cent share
- Small SUV: 13.7 per cent share
- Large SUV: 12.5 per cent share
- Small Car: 6.3 per cent share
Sales by buyer type
- Private buyers: 303,519, up 4.8 per cent
- Business fleets: 204,998, up 13.3 per cent
- Rental fleets: 31,421, up 2.1 per cent
- Government fleets: 15,227, up 6.6 per cent
Sales by propulsion or fuel type
- Petrol: 294,289, up 6.6 per cent
- Diesel: 175,939, down 5.3 per cent
- Electric: 43,092, up 345.2 per cent
- Hybrid: 38,313, down 6.7 per cent
- PHEV: 3532, up 20.1 per cent
- HydrogenFCEV: 0
Sales by country of origin
- Japan: 154,647, down 10.3 per cent
- Thailand: 122,300, down 2.7 per cent
- China: 95,852, up 93.1 per cent
- Korea: 82,998, up 2.3 per cent
- Germany: 26,055, up 28.0 per cent
Some previous monthly reports
Got any questions about car sales? Ask away in the comments and we’ll jump in!