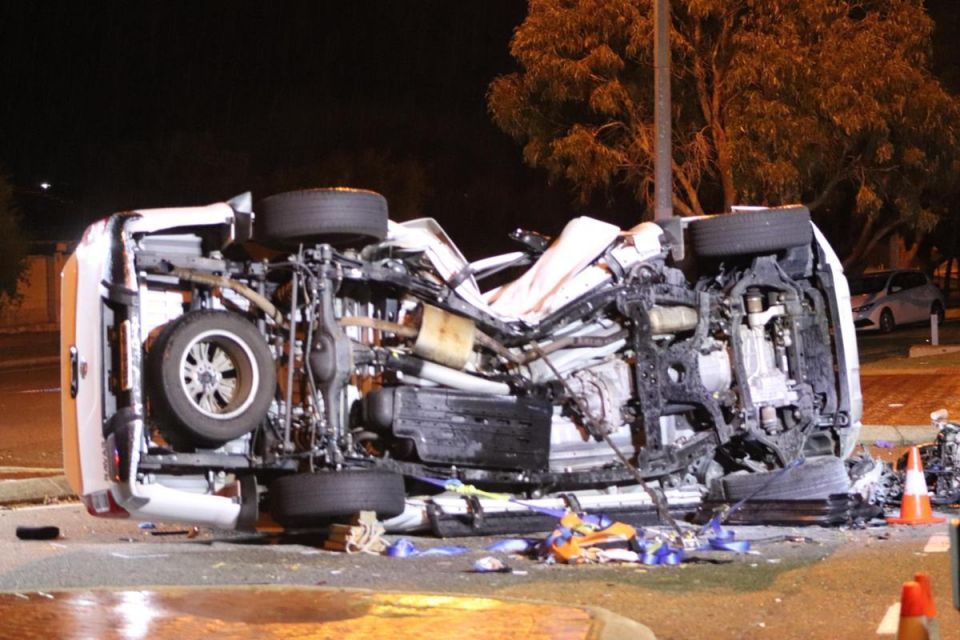
It’s hard to say what demographic or age group causes the most car accidents on Australian roads, because there are a lot of instances where no driver believes they are at fault. Nonetheless, the data shows that it’s not necessarily the learner drivers or P-Platers mostly at fault.
- Data shows those in the 40-59 age bracket are most injured in vehicle accidents
- Those in the 40-64 age bracket are most likely to be killed in a vehicle accident
That sort of car crash data is really hard to extract, let alone extrapolate. There are countless bingles and bumper crunches on roads all around Australia, and not all people own up or put the documentation through their insurance company – so it is almost impossible to point the finger at a specific age group as being the main cause of crashes and car accidents on Australian roads.
However, there is data from the Department of Infrastructure’s Office of Road Safety that points to some alarming statistics for those most likely to be injured and killed in vehicle accidents.
The age group most likely to be in accidents involving vehicles, according to the data, is the 40-59 years group, which accounted for 10,980 cases from a total 39,755 hospitalisations in Australia in 2018-19.
That figure comes from the Serious Injuries from Road Crashes Dashboard data, which also showed that, when it comes to vehicular accident injuries over that period, 25,257 were male, and 14,196 were female.
Car accidents by age group
Here’s a rundown of the age groups that were affected by vehicle accidents and required hospitalisation in the 2018-19 period:
- 0-16 years – 3155
- 17-25 – 8380
- 26-39 – 9627
- 40-59 – 10,980
- 60-69 – 3536
- 70 and over – 3776
It has to be pointed out that the group 40-59 years is the biggest age bracket, and as such it is not really all that surprising that it had higher numbers than those in different age groups. Indeed, the age bracket below could actually be seen as more highly represented because it is a smaller age group window.
Road toll by age group
The National Crash Dashboard data for 2021 indicated that 1116 Australians died in vehicle accidents in Australia. Here is a breakdown of the age groups involved:
- 0-7 years – 21
- 8-16 years – 41
- 17-25 – 212
- 26-39 – 242
- 40-64 – 347
- 65-74 – 112
- 75 and over – 135
It is worth noting that the 40-64 age bracket in the data is the broadest grouping, and based on 2021 Census data, that age grouping accounted for 31.1 per cent of the entire population.
As such, it could be deduced that, as a percentage of the population, that age bracket was not necessarily overrepresented in the statistics – of all the deaths on the road in 2021, it was, coincidentally, 31.1 per cent.
For reference, the “75 and over” bracket accounted for more than 12 percent of total deaths on Australian roads for the period, yet only accounted for 7.5 per cent of the population based on 2021 data. It could be assumed that those in that age bracket may also be far less likely to be driving than people in the younger age groups, too.
Not intended as legal advice. Check with the relevant roads authority in your state or territory.