
William Stopford
2026 Leapmotor B05 price and specs
The Leapmotor B05 is the Chinese brand's first non-SUV model in Australia, and will also be its cheapest vehicle yet.
4 Hours Ago
With no government-led CO2 scheme, the car industry has its own. While the 2030 target is what matters, most brands are behind their goal.

Senior Contributor

Senior Contributor
A majority of Australia’s car brands failed to hit their voluntary specific CO2 emissions targets in 2021, though passenger vehicles as a whole are ahead of the reduction curve.
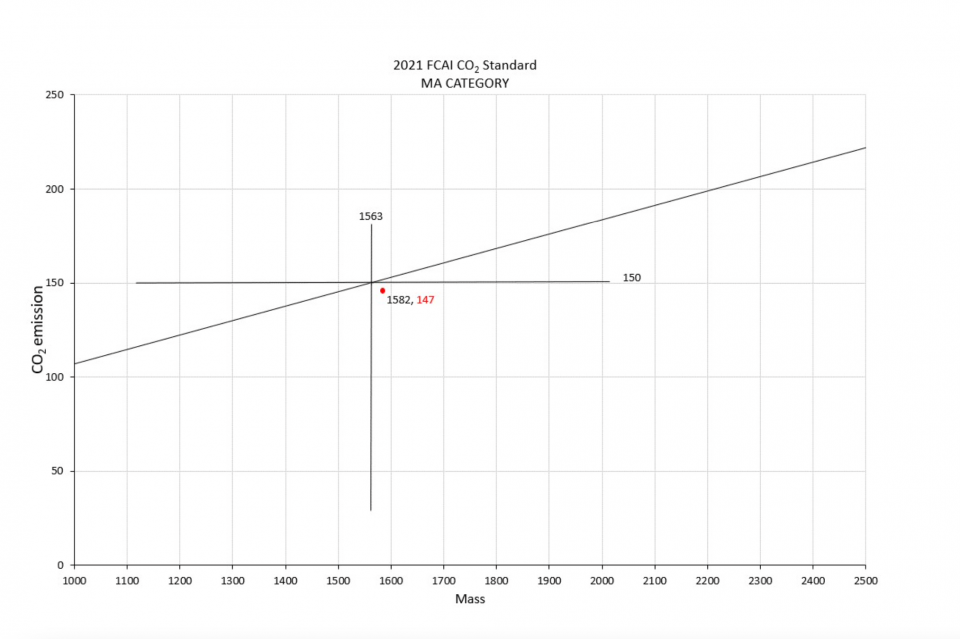
The average listed CO2 emissions of vehicles belonging to the scheme’s so-called MA category (passenger vehicles and so-called light-duty SUVs) was 146.5 grams per kilometre, down from 149.5g/km in 2020 and ahead of the specific 2021 target average of 150g/km.
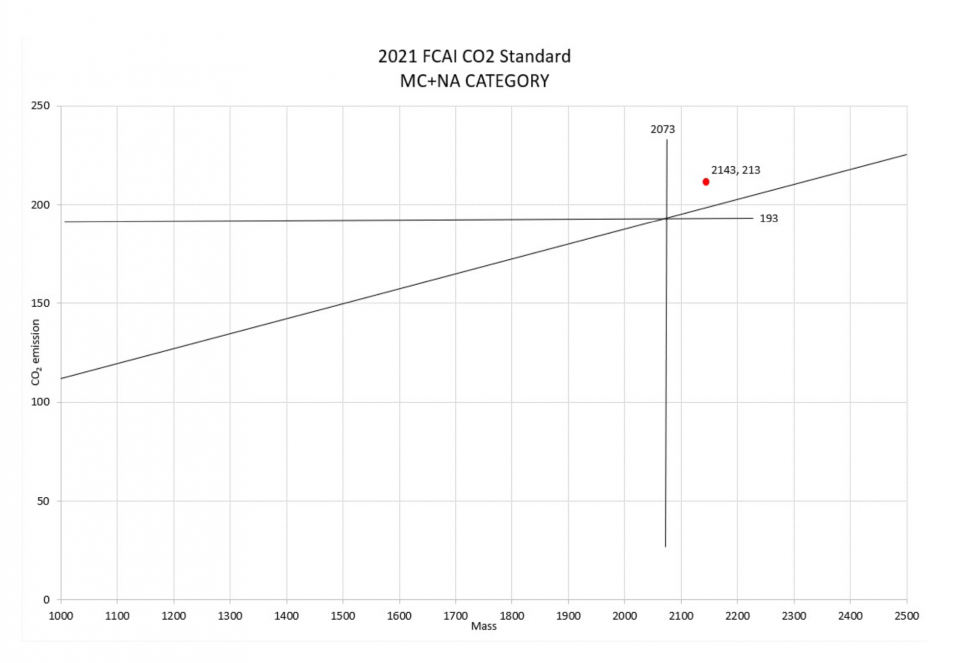
But vehicles in the MC+NA category (light commercials and heavy SUVs) missed their target by a big margin, averaging 212.5g/km against a target of 193g/km. On the positive side, the average for 2021 did fall from 2020’s average of 216.7g/km.
However, the Federal Chamber of Automotive Industries (FCAI), which oversees the brands’ self-imposed scheme, says it’s the final 2030 emissions target that matters, with annual inconsistencies on the way to be expected.
The FCAI’s targeted reduction between 2020 and 2030 is to get MA vehicles down to 100g/km and MC+NA vehicles to 145g/km. It says brands will progress at different rates, depending on their model cycles, and the lack of legal teeth means this will remain a factor.
The FCAI is the peak body for the car-makers, and really has its own progressive and self-imposed CO2 reduction targets in place to set a template – because it wants the government to enforce just such a scheme with penalties, and thereby incentivise brand head offices overseas to send more low-emission vehicles our way.
“If we don’t have that legislation in the market, then they’re [HQ in Europe] going to prioritise the markets that have got it, to avoid very significant fines. It changes the game completely, it really does,” Volkswagen Group Australia chief Paul Sansom told CarExpert recently.
MORE: Australian car industry keeps calling for new government-backed CO2 targets
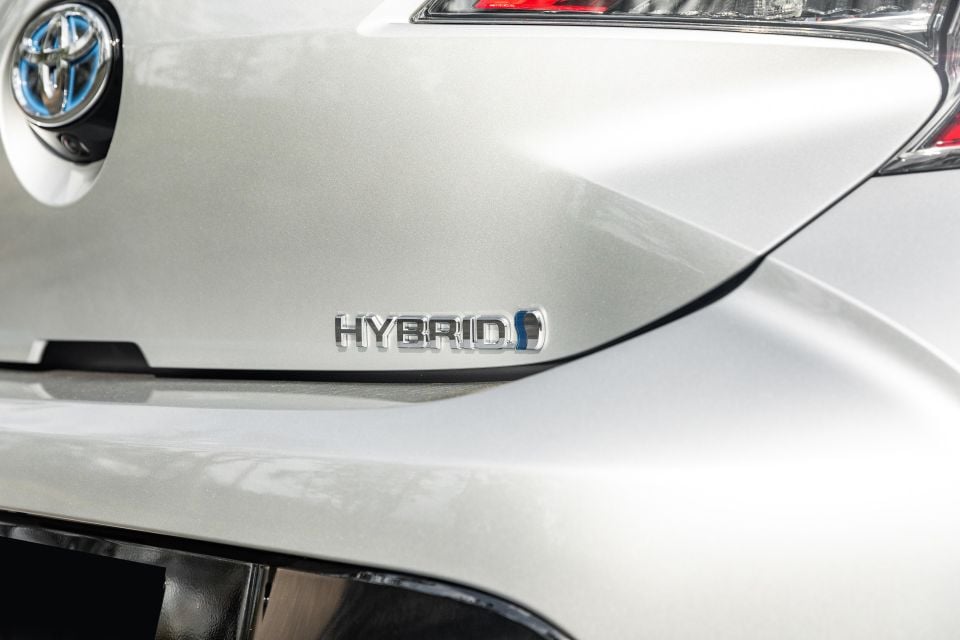
Market-leader Toyota led the field in the passenger car and light SUV category thanks to its hybrid dominance, but failed to comply with its 2021 target when it came to its heavy 4x4s and commercials.
The annual FCAI emissions report collates each member brand’s CO2 outputs on a complicated sales-weighted average mass per unit basis, with various full-forward credits outlined in the methodology explaining why the average output per car looks lower than what the ADR claims suggest.
For example, Toyota’s overall market-leading MA category CO2 average per vehicle of 96.7g/km would suggest it sold entirely Corolla Hybrids, ignoring the thirstier models it offered too.
If you want the full detail on how the scheme is created and measured, this deep-dive here should help. It’s quite a challenging read…
The FCAI counters by saying the complex mathematical measurements are designed to be broadly similar in method to those used by the European Environment Agency, as well as the scheme used in the USA – though lower EV take-up here means the actual targets are higher.
These targets are in no way legally binding or enforceable anywhere beyond the court of public opinion, until there’s actual legislation around them.
“Globally automotive manufacturers continue to spend billions of dollars on reducing the environmental impact of their vehicles. In the absence of a federally led emissions reduction target, FCAI members have signed up to this Standard to support the introduction of the cleanest technologies to Australia’s road,” said FCAI CEO Tony Weber.
| Brand | Sales | Average CO2 | Target |
|---|---|---|---|
| Alfa Romeo | 617 | 145.554 | 153.163 |
| Alpine | 28 | 146.000 | 120.487 |
| Audi | 15,810 | 157.710 | 163.355 |
| BMW | 19,827 | 160.665 | 163.785 |
| Chrysler | 168 | 300.478 | 194.817 |
| Citroen | 180 | 142.128 | 134.075 |
| Ferrari | 189 | 254.676 | 162.219 |
| Fiat | 736 | 115.368 | 112.697 |
| Ford | 9718 | 192.314 | 158.428 |
| Genesis | 734 | 238.77 | 191.735 |
| GWM | 9676 | 185.493 | 150.752 |
| Honda | 17,563 | 159.856 | 146.030 |
| Hyundai | 69,815 | 163.696 | 145.677 |
| Isuzu Ute | 2789 | 209.370 | 193.538 |
| Jaguar | 1221 | 164.746 | 175.244 |
| Jeep | 821 | 201.379 | 164.639 |
| Kia | 67,694 | 159.682 | 148.027 |
| Lamborghini | 131 | 328.931 | 177.965 |
| Land Rover | 2409 | 191.278 | 183.806 |
| LDV | 1597 | 254.944 | 200.536 |
| Lexus | 8990 | 135.306 | 175.271 |
| Maserati | 560 | 240.132 | 192.71 |
| Mazda | 82,711 | 155.713 | 151.803 |
| Mercedes-Benz Cars | 27,807 | 165.205 | 177.484 |
| Mercedes-Benz Vans | 588 | 158.378 | 224.029 |
| MG | 39,534 | 143.662 | 136.392 |
| Mini | 3541 | 105.524 | 139.885 |
| Mitsubishi | 37,670 | 160.094 | 147.28 |
| Nissan | 22,524 | 166.354 | 151.124 |
| Peugeot | 2258 | 144.096 | 141.531 |
| Porsche | 3599 | 136.107 | 179.619 |
| Renault | 2892 | 175.398 | 151.002 |
| Skoda | 9172 | 141.168 | 147.925 |
| SsangYong | 353 | 177.008 | 150.131 |
| Subaru | 14,769 | 162.575 | 148.656 |
| Suzuki | 14,612 | 125.465 | 115.582 |
| Toyota | 100,448 | 96.731 | 151.871 |
| Volkswagen | 29,623 | 144.741 | 151.701 |
| Volvo Car | 5671 | 132.073 | 179.433 |
| Brand | Sales | Average CO2 | Target |
|---|---|---|---|
| Audi | 192 | 173.682 | 205.799 |
| BMW | 5,049 | 170.970 | 174.865 |
| Chevrolet | 2108 | 297.000 | 233.134 |
| Ford | 60,234 | 211.617 | 209.358 |
| GWM | 8697 | 243.756 | 193.987 |
| Hyundai | 3057 | 219.348 | 189.711 |
| Isuzu Ute | 32,927 | 207.868 | 193.980 |
| Jeep | 6883 | 224.546 | 204.980 |
| Land Rover | 4044 | 207.342 | 212.856 |
| LDV | 11,607 | 244.053 | 191.524 |
| Lexus | 300 | 301.516 | 249.392 |
| Mazda | 18,408 | 205.417 | 189.806 |
| Mercedes-Benz Cars | 594 | 295.143 | 237.707 |
| Mercedes-Benz Vans | 1017 | 174.678 | 194.857 |
| Mitsubishi | 30,067 | 219.770 | 190.520 |
| Nissan | 18,279 | 228.443 | 206.865 |
| Peugeot | 516 | 150.456 | 159.365 |
| Porsche | 833 | 185.960 | 202.242 |
| Ram | 3819 | 278.683 | 239.659 |
| Renault | 2825 | 164.525 | 167.485 |
| SsangYong | 2628 | 226.615 | 206.646 |
| Subaru | 22,252 | 156.066 | 165.422 |
| Suzuki | 2856 | 151.996 | 124.942 |
| Toyota | 120,517 | 216.544 | 204.911 |
| Volkswagen | 10,078 | 223.061 | 188.446 |
| Volvo Car | 3357 | 169.435 | 179.900 |
MORE: Emissions targets explained: Q&A with FCAI chief executive Tony Weber
William Stopford
4 Hours Ago

William Stopford
4 Hours Ago


Matt Campbell
12 Hours Ago

Dave Kavermann
19 Hours Ago
William Stopford
22 Hours Ago


Damion Smy
23 Hours Ago
Add CarExpert as a Preferred Source on Google so your search results prioritise writing by actual experts, not AI.